5.un
UNITED STATES
SECURITIES AND EXCHANGE COMMISSION
WASHINGTON, D.C. 20549
FORM
(Mark One)
ANNUAL REPORT PURSUANT TO SECTION 13 OR 15(d) OF THE SECURITIES EXCHANGE ACT OF 1934 |
For the fiscal year ended
OR
TRANSITION REPORT PURSUANT TO SECTION 13 OR 15(d) OF THE SECURITIES EXCHANGE ACT OF 1934 |
For the transition period from to __________
Commission file number
(Exact name of registrant as specified in its charter)
|
||
(State or Other Jurisdiction of Incorporation or Organization) |
|
(I.R.S. Employer Identification No.) |
|
||
(Address of Principal Executive Offices) |
|
(Zip Code) |
(
(Registrant’s Telephone Number, Including Area Code)
Securities registered pursuant to Section 12(b) of the Act:
Title of each class |
|
Trading Symbol(s) |
|
Name of each exchange on which registered |
|
|
Securities registered pursuant to Section 12(g) of the Act: None
Indicate by check mark if the registrant is a well-known seasoned issuer, as defined in Rule 405 of the Securities Act.
Indicate by check mark if the registrant is not required to file reports pursuant to Section 13 or Section 15(d) of the Exchange Act. Yes ☐
Indicate by check mark whether the Registrant (1) has filed all reports required to be filed by Section 13 or 15(d) of the Securities Exchange Act of 1934 during the preceding 12 months (or for such shorter period that the Registrant was required to file such reports), and (2) has been subject to such filing requirements for the past 90 days.
Indicate by check mark whether the registrant has submitted electronically every Interactive Data File required to be submitted pursuant to Rule 405 of Regulation S-T (§ 232.405 of this chapter) during the preceding 12 months (or for such shorter period that the registrant was required to submit such files).
1
Indicate by check mark whether the registrant is a large accelerated filer, an accelerated filer, a non-accelerated filer, smaller reporting company, or an emerging growth company. See the definitions of “large accelerated filer,” “accelerated filer,” “smaller reporting company,” and “emerging growth company” in Rule 12b-2 of the Exchange Act.
☒ |
Accelerated filer |
☐ |
|
Non-accelerated filer |
☐ |
Smaller Reporting Company |
|
Emerging growth company |
|
|
If an emerging growth company, indicate by check mark if the registrant has elected not to use the extended transition period for complying with any new or revised financial accounting standards provided pursuant to Section 13(a) of the Exchange Act. ☐
Indicate by check mark whether the registrant has filed a report on and attestation to its management’s assessment of the effectiveness of its internal control over financial reporting under Section 404(b) of the Sarbanes-Oxley Act (15 U.S.C. 7262(b)) by the registered public accounting firm that prepared or issued its audit report.
If securities are registered pursuant to Section 12(b) of the Act, indicate by check mark whether the financial statements of the registrant included in the filing reflect the correction of an error to previously issued financial statements.
Indicate by check mark whether any of those error corrections are restatements that required a recovery analysis of incentive-based compensation received by any of the registrant’s executive officers during the relevant recovery period pursuant to §240.10D-1(b). ☐
Indicate by check mark whether the registrant is a shell company (as defined in Rule 12b-2 of the Exchange Act). Yes
The aggregate market value of the shares of voting common stock held by non-affiliates of the Registrant, computed by reference to the closing sales price of such shares on the New York Stock Exchange, as of the last business day of the Registrant’s most recently completed second fiscal quarter was $
The Registrant had
DOCUMENTS INCORPORATED BY REFERENCE
Portions of the Registrant’s Proxy Statement for the 2025 Annual Meeting of Shareholders to be held June 5, 2025, which is expected to be filed with the Securities and Exchange Commission on or about April 23, 2025, have been incorporated by reference into Part III, Items 10, 11, 12, 13 and 14 of this Annual Report on Form 10-K.
2
Helios Technologies, Inc.
INDEX
For the year ended
December 28, 2024
|
|
|
Page |
|
|
|
|
||
|
|
|||
|
|
|
|
|
|
Item 1. |
|
4 |
|
|
|
|
|
|
|
Item 1A. |
|
15 |
|
|
|
|
|
|
|
Item 1B. |
|
30 |
|
|
|
|
|
|
|
Item 1C. |
|
30 |
|
|
|
|
|
|
|
Item 2. |
|
31 |
|
|
|
|
|
|
|
Item 3. |
|
32 |
|
|
|
|
|
|
|
Item 4. |
|
32 |
|
|
|
|
|
|
|
|
|||
|
|
|
|
|
|
Item 5. |
|
33 |
|
|
|
|
|
|
|
Item 6. |
|
35 |
|
|
|
|
|
|
|
Item 7. |
Management's Discussion and Analysis of Financial Condition and Results of Operations |
|
36 |
|
|
|
|
|
|
Item 7A. |
|
48 |
|
|
|
|
|
|
|
Item 8. |
|
49 |
|
|
|
|
|
|
|
Item 9. |
Changes in and Disagreements With Accountants on Accounting and Financial Disclosure |
|
86 |
|
|
|
|
|
|
Item 9A. |
|
86 |
|
|
|
|
|
|
|
Item 9B. |
|
87 |
|
|
|
|
|
|
|
Item 9C. |
Disclosure Regarding Foreign Jurisdictions that Prevent Inspections |
|
87 |
|
|
|
|
|
|
|
|
|
|
|
|
|
|
|
|
Item 10. |
|
88 |
|
|
|
|
|
|
|
Item 11. |
|
88 |
|
|
|
|
|
|
|
Item 12. |
Security Ownership of Certain Beneficial Owners and Management and Related Stockholder Matters |
|
88 |
|
|
|
|
|
|
Item 13. |
Certain Relationships and Related Transactions, and Director Independence |
|
88 |
|
|
|
|
|
|
Item 14. |
|
88 |
|
|
|
|
|
|
|
|
|
|
|
|
|
|
|
|
|
Item 15. |
|
89 |
|
|
|
|
|
|
|
Item 16. |
|
94 |
|
|
|
|
|
|
|
|
|
95 |
|
3
PART I
ITEM 1. BUSINESS
Our Business
Overview and Strategy
Helios Technologies, Inc. (“Helios,” the “Company,” “we,” “us” or “our”), and its wholly owned subsidiaries, is a global leader in highly engineered motion control and electronic controls technology for diverse end markets, including construction, material handling, agriculture, industrial, mobile, energy, recreational vehicles, marine, aerospace, and health and wellness.
We operate under two business segments: Hydraulics and Electronics. The Hydraulics segment designs and manufactures hydraulic motion control and fluid conveyance technology products, including cartridge valves, manifolds and quick release couplings as well as engineers complete hydraulic system solutions and in some cases complete systems. The Electronics segment designs and manufactures customized electronic controls systems, displays, wire harnesses, and software solutions for a variety of end markets.
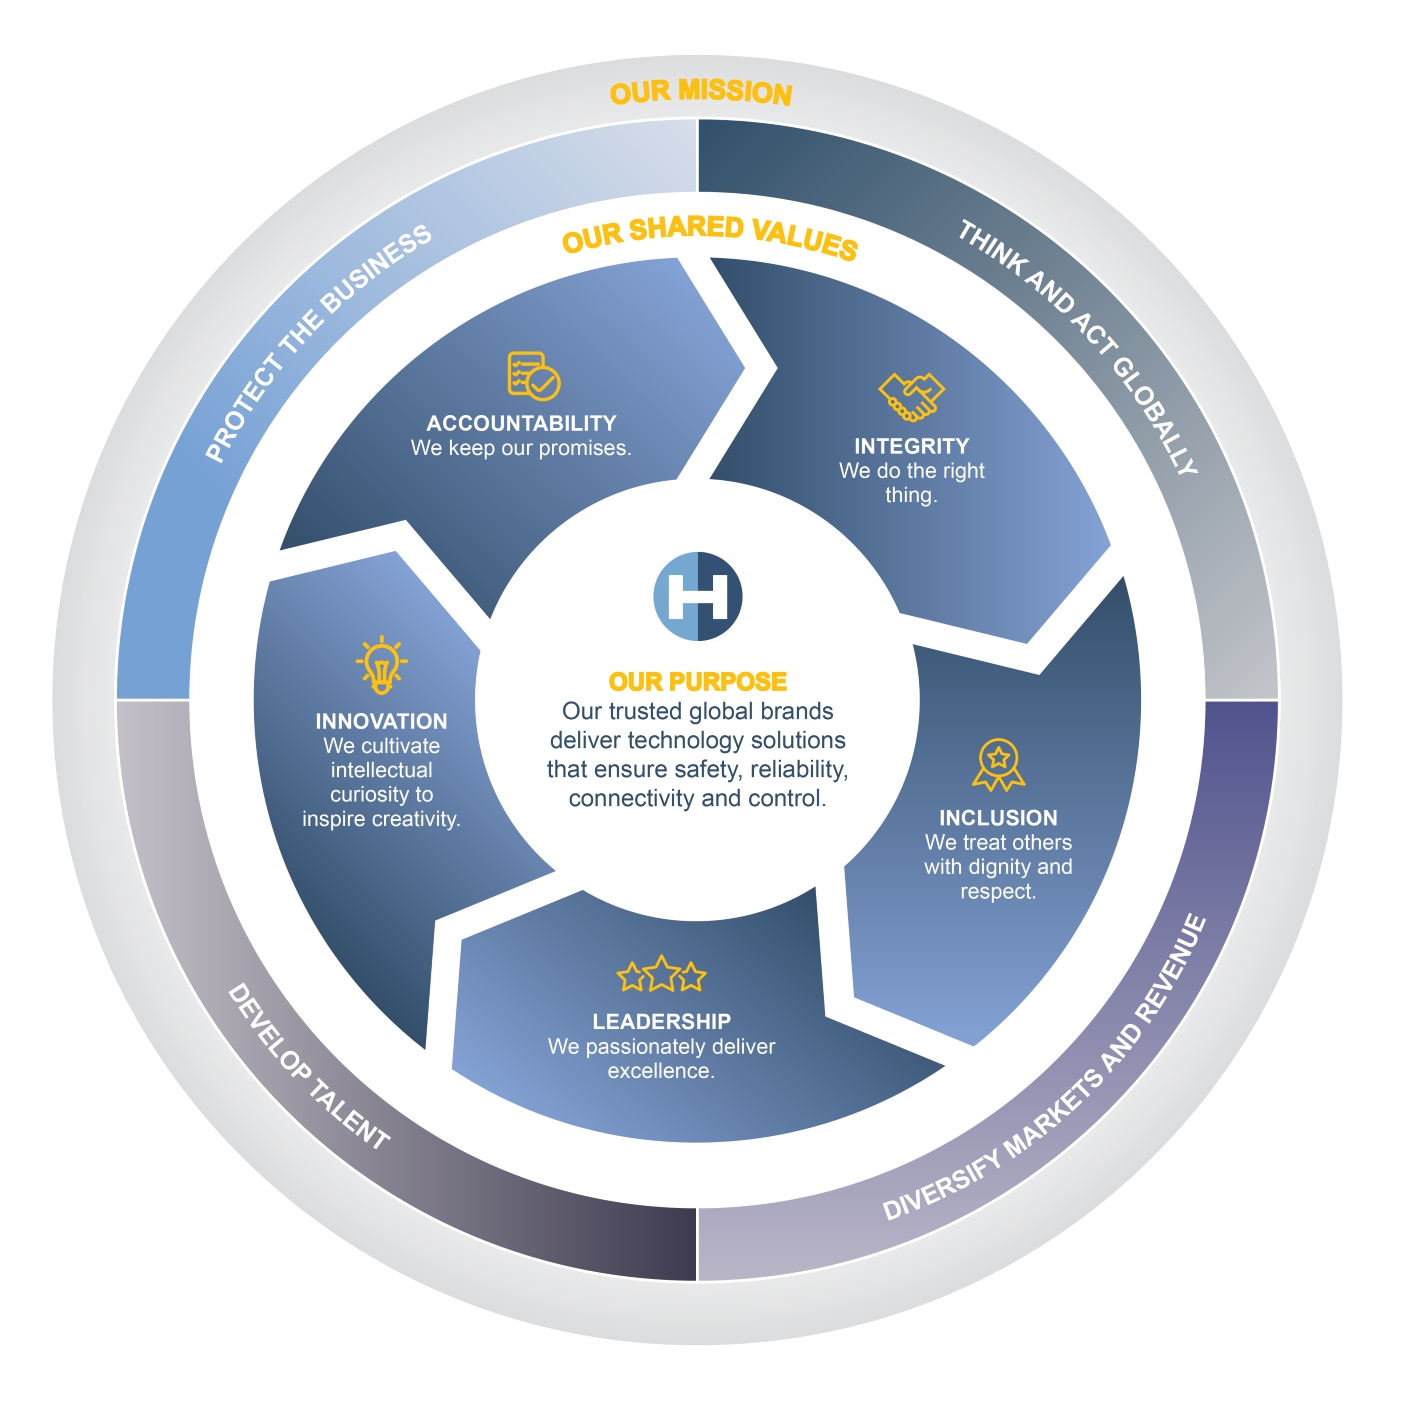
We are a global operating company and the framework of the Helios Business System, (“HBS”) (pictured below), is at the heart of all we do. With our global operating network we work to leverage sales, marketing, innovation, customer relationships and operational excellence across all our businesses. We are committed to leveraging our resources to best serve our customers and explore new opportunities.
4
Our trusted global brands deliver technology solutions that ensure safety, reliability, connectivity and controls. The outer ring of the HBS is our mission - the four key mission pillars we believe will deliver growth, diversification and market leading financial performance as we develop into a more sophisticated, globally oriented, customer-centric and learning-based organization. These are:
With the current initiatives to pay down debt and to invest in organic sales and operational efficiencies, we are positioning the business to explore future acquisition opportunities as a way to supplement our organic growth with niche technologies and strong profitability. In addition to looking for strong management teams and good cultural fit, the objective of our acquisition strategy is to enhance Helios by:
5
To support the execution of our acquisition strategy, our financial focus is oriented around delivering industry leading operating margins, a strong balance sheet and sufficient financial flexibility to support organic and acquisitive growth while maintaining our longstanding history of over twenty-seven years of dividend payments.
We align our internal key performance indicators with our strategy to ensure our short-term actions will deliver long-term expectations.
Our culture of innovation is at the core of our business. We have over 230 engineers in support of product innovation, as well as technical support and customer service. We believe our product innovation will aid organic growth and fill the expected demand resulting from the megatrends of automation, digitalization, regionalization and supply chain security, productivity and technology advancements. All growth initiatives are intended to preserve Helios’ history of superior profitability and financial strength.
Acquisitions
Over the last three years under our strategy, we have added to our portfolio of niche technologies through acquisitions:
6
In 2024, the Company continued to explore and evaluate potential acquisitions, but no acquisitions were executed.
Business Segments
Our Hydraulics segment includes products sold under the Sun Hydraulics, Faster, Custom Fluidpower, Seungwon, NEM, Taimi, Daman and Schultes brands. The Electronics segment includes products sold under the Enovation Controls, Murphy, Zero Off, HCT, Balboa Water Group and Joyonway brands. Financial information about our business segments is presented in Note 16 of the Notes to the Consolidated Financial Statements.
Hydraulics
We have evolved how we classify the key technologies within our Hydraulics segment into two categories based on Hydraulic system architecture: motion control technology (“MCT”) and fluid conveyance technology (“FCT”). MCT includes components used to control the flow and pressure of fluids in a system. FCT includes components used to convey fluids and fluid power through a system and are designed to grant maximum flexibility of design and reliability. MCT includes our Sun Hydraulics cartridge valve technology where we pioneered a fundamentally different design platform employing a floating nose construction that results in a self-alignment characteristic. This design provides better performance and reliability advantages compared with most competitors’ product offerings. MCT also includes a range of common cavity solutions with our Sun, Seungwon and NEM brands as well as parts in body ("PiB") solutions from NEM.
Our cartridge valves are offered in several size ranges and include both electrically actuated and hydro-mechanical products. They are designed to be able to operate reliably at higher pressures than most competitors, making them equally suitable for both industrial and mobile applications.
Hydraulic systems are increasingly taking signals from on-board electronic control systems, making it necessary for hydraulic products to be capable of digital communication. In response to this, we have aggressively expanded our MCT offering of electrically actuated cartridge valves and have significant technology in PiB and directional control valves with NEM.
Additionally, our MCT ecoline™ family is a collection of products focused on increasing the energy efficiency of hydraulic systems. Also, an aggressive segment of new product development that focuses on disruptive technology is yielding results with the announcement of the ENERGEN™ product. ENERGEN™ is the first hydraulic cartridge valve with the capability to convert hydraulic flow into electrical power.
7
Our FCT products transfer hydraulic fluid from one point to another. FCT includes our quick release couplings products, which allow users to connect and disconnect quickly from any hydraulic circuit without leakage and ensures high-performance under high temperature and pressure using one or multiple couplers. Quick connection of multiple hydraulic lines can be accomplished through the use of our casting solution or our signature MultiFaster® product line. In particular, the simultaneous connection of several lines granted by our Multifaster® is an important feature in many applications and allows for dramatic reduction of connection time, even when the system is under pressure, and completely removes the risk of incorrect connections and related hazards for the equipment and the operators. We design, engineer and distribute hydraulic coupling solutions primarily in the agriculture, construction equipment and industrial markets. In 2021, our FCT subsidiary, Faster S.r.l, was selected as a recipient of the John Deere Supplier Innovation Award for 2020, for its multi-connection couplings with integrated valve system. The award was presented to a select group of Suppliers who demonstrated innovation in a product or service they provide to John Deere. Award selections are based on four factors: creativity, feasibility, collaboration and bottom-line impact. In synergy with our Sun Hydraulics business, our engineering teams have combined the advantages and features of MultiFaster® and electro-hydraulic cartridge valves into an integrated manifold, reducing complexity and increasing reliability of the hydraulic circuit as a result. In 2022, Faster won the Systems and Components Trophy – Engineers Choice from DLG (the German Agricultural Society) for its innovative Faster ABC electronic hydraulic hose coupling. DLG recognizes components or systems with novel or significantly improved concepts that can make a significant contribution to the development and production of agricultural machinery and other off-highway machinery.
Our strategic acquisitions have expanded our addressable markets by providing additional know-how and intellectual property, which grant us access into industrial multi-connections, mostly automatically actuated, in fields like steel mills, automotive engine test beds, aeronautics and plastic injection. These multi-connections are typically custom designed for a particular application and handle not just hydraulic but also various process fluids and electrical signals of low, medium and high voltage. In addition, the Taimi acquisition was a bolt-on technology that we believe fits well with our coupling offerings. Taimi developed a hose line accessory with innovative technology granting superior life and performance, not just for the swivel itself but effectively expanding the hose life by up to ten times in heavy duty applications where hose bending and torsion under severe pressure conditions are normal. This expanded our market reach into mining, forestry equipment and high-end sailing solutions.
Many of the current Faster, Taimi, Sun Hydraulics and NEM brand products can be easily combined to form an integrated hydraulic circuit, or system solution, of high technological content.
These circuits and systems provide engineered solutions that combine manifolds, MCT and FCT technology and allow users enhanced control of existing equipment, providing a competitive advantage and opportunities for higher margin. The systems we design and manufacture:
8
Electronics
We are an international leader in custom-tailored solutions for many industrial and commercial applications, including engines, engine-driven equipment and specialty vehicles with a broad range of rugged and reliable instruments such as displays, controls and instrumentation products through our Enovation Controls, Zero Off, Murphy and HCT brands. With the Balboa Water Group and Joyonway brands, we are also a global industry leader in the health and wellness market providing comprehensive electronic control systems with proprietary and patented technology for therapy bath, cold plunges, traditional hot tubs and swim spas.
As an innovative manufacturer of electronic controls and displays, we serve a variety of markets including off-highway, recreational marine, powersports and specialty vehicles, agriculture, water pumping, power generation, engine-driven industrial equipment, and health and wellness. We partner directly with OEMs ("Original Equipment Manufacturer") and support a worldwide network of authorized distributors and systems integrators. We make significant investments to garner an intense understanding of unique applications to solve complex system challenges.
Our focus is on creating customized systems that solve complex problems for niche mid-market volume customers. This allows us to target customers or industries that see value in this level of integration, and as a result, our product list contains a wide variety of OEM applications. Product categories include traditional mechanical and electronic gauge instrumentation, plug and go CAN-based instruments, robust environmentally sealed controllers, hydraulic controllers, pumps and water flow systems, engineered panels, process monitoring instrumentation, printed circuit board assembly and wiring harnesses. Our technologies can be used in both mobile, DC power applications, as well as fixed, AC power applications, enabling us to provide products and services across a broad base of applications.
Our PowerView™ and next generation OpenView™ lines of LCD displays offer our customers the ability to work with our engineering teams to specify and utilize customized software and graphics for their electronics solutions. Our OpenView™ displays include the same robust features and quality of our PowerView™ displays while also allowing our customers the ability to use open source Linux-based operating system and various software development tools to create their own graphics and custom applications for their electronics solutions making implementation of OpenView™ products more adoptable and flexible for our customers. All of our displays offer easy-to-read, bonded LCD graphical interfaces with the industry's best viewability, even in direct sunlight or harsh weather conditions, and the ability to withstand a wide ambient temperature range. We believe our user friendly software configuration tools allow engineers and non-engineers alike to create customized systems to solve complex problems on their equipment making the user experience more seamless.
Our panel solutions offer customized design and simple, turnkey solutions and our Custom Hardware Solutions team has engineers dedicated to applications, wire harnesses, panels and software development. Engineers focus entirely on custom and standard solutions built to desired specifications. Our services for design and development include on-site installation and testing to ensure the solution works with the application out of the box.
Technology and Innovation
We are an innovative products and technology focused company. Our talented engineering teams within our Hydraulics and Electronics Segments and our central engineering teams work cross-functionally and seamlessly to develop innovative, industry leading products that address our customers' needs while also addressing the trend toward electrification of machines and full electro-hydraulic system solutions. While the core technology of our products has been critical to our Company’s historical success and will remain important in the future, we see significant opportunities to develop innovative technology encompassing both the Hydraulics and Electronics segments to create new products to address future market trends and further diversify our end markets.
Manufacturing
Strategy
9
As we have been further integrating our operating companies, we have developed a more harmonious operations strategy across the companies in our Electronics and Hydraulics segments. This strategy leverages the breadth of our global footprint and depth of our manufacturing capabilities.
In support of our mission to “Think and Act Globally”, we are driving “in the region, for the region” manufacturing to better align supply chain and manufacturing value streams with customers geographically to shorten lead times, reduce inventory, optimize costs, and mitigate global supply risks. Established manufacturing centers provide scale in North America, and we continue to optimize centers in both Asia and Europe to gain efficiencies and meet global demand over time. Manufacturing locations in the U.S., Canada, Mexico, Italy, Germany, South Korea, China and India provide a range of manufacturing options.
Our factory and supplier management is grounded in a people first approach that leverages the talents of our diverse global operations team. All global sites operate to high standards of stewardship and social responsibility. Structured programs ensure our supply chains comply with Conflict Minerals standards.
Hydraulics
Our Hydraulics operations footprint leverages manufacturing centers in North America, Europe, and Asia. Established supplier relationships and manufacturing capabilities in precision machining, finishing, heat treatment and test allow us to deliver best in class quality and market leading hydraulic control solutions.
We leverage Lean Six Sigma best practices and automation to continually improve the safety, quality, and productivity of our operating processes.
Electronics
We offer a wide range of advanced electronics manufacturing capabilities that deliver integrated electronic control solutions to diverse end markets. Manufacturing value streams incorporate high speed surface mount technology, production lines with 3D solder paste inspection, 3D automated optical inspection and x-ray inspection to ensure quality and process control. Multipoint functional testing is conducted to ensure quality control of assembled products. Products are serialized and test data is captured against serial numbers and stored in a manufacturing execution system database for product traceability.
Sales and Marketing
In 2024, no single customer made up more than 5% of consolidated net sales across the Company.
Strategy
One of the key drivers of future growth for both the Electronics and Hydraulics segments is our system solution approach that leverages electronic and hydraulic solutions from our trusted brands. While always protecting our existing business, we will provide strategic OEM partners with “system solutions” that ensure the safety, reliability, connectivity and control of their applications.
Our two segments are comprised of approximately 125 direct sales and application specialists serving our customers’ needs. We will continue to use this long successful approach while supplementing our strategy by pursuing system solutions at key global OEM’s to drive growth.
Hydraulics
In 2024, 67% of Helios’ sales were derived from the Hydraulics segment. Our 2024 Hydraulics segment sales were distributed fairly evenly among our three major geographic regions with 41% to the Americas, 29% to Europe, the Middle East and Africa (“EMEA”) and 30% to Asia Pacific (“APAC”).
10
We market and sell hydraulic products and engineered solutions through value-added distributors and directly to OEMs. Our global channel partner network includes representation in many industrialized markets, and approximately 49% of segment sales are attributed to our channel partners who generally combine our products with other hydraulic components to design a complete hydraulic system. Sales direct to OEMs for integration in their machines make up the remaining 51%. We rely heavily on our distribution network in the U.S., while in the EMEA and APAC regions, sales are split more evenly between OEMs and distributors. Technical support is provided by local sales and application experts based in each region.
Electronics
Electronic products are sold globally to OEM customers, distributors and system integrators. OEM sales constituted 78% of total Electronics segment sales in 2024. Building strong, lasting partnerships with OEMs is a priority. We rely on direct customer contacts to stimulate demand for our products. We work closely with our OEM customers to design and deliver innovative and reliable products for specific applications. Our hardware and software products are designed and modified with the customer utilizing our extensive application knowledge to create unique system level products that cannot be easily replaced by simply switching out components. Customer service support and an in-house technical service department is available before, during and after the initial sale to create sustainable partnerships with our customers. Current OEM customers continue to specify our products in new projects based on the high level of engagement, quality products and delivery performance.
Our OEM sales team collaborates with large OEMs, whereas the distributor sales team works with an expanding number of distributors of varying sizes. Over the last few years, we restructured our sales teams to create a more dedicated focus on distributor sales. Overall, approximately 22% of 2024 segment sales were derived from independent authorized distributor channel partners.
We continue to execute on our strategic initiative to further diversify our channels to market and end markets served. In addition to acquisitions such as Balboa Water Group and Joyonway, this effort includes the development of new partners globally. These efforts assist in our ability to diversify our global customer base, allowing us to grow more quickly, diversify the end-markets we serve and expand our customer base.
Our new product initiatives in the Electronics Segment are focused on general market products that will require less customization by our engineering teams and provide a quicker sales cycle, making it easier for the products to be utilized in multiple new end markets and OEM applications.
Geographically, our 2024 Electronics segment sales were 80% in the Americas, 10% in EMEA and 10% in APAC. There is a well-defined initiative to grow sales in EMEA and APAC as part of our growth strategy. Additionally, we utilize customer relationships from the Hydraulics segment to create pull through of electronic products, and joint product development has created additional sales opportunities for both segments. The system solutions approach will further drive pull through between the segments.
Competition
Hydraulics
Competitors in the hydraulics market are broken down into three categories: full-line hydraulic systems producers, component-only producers of MCT or FCT products and low-cost producers. Most competitors market globally. Full-line producers, such as Parker Hannifin, Danfoss/Eaton and Bosch Rexroth/HydraForce, can provide complete hydraulic systems to their customers, including components functionally like those manufactured in our Hydraulics segment. Component-only producers are entities that offer only MCT or FCT products, while additional parts of the hydraulics system are obtained from other manufacturers. These include Delta Power Company, Stucchi and CEJN. Low-cost producers, such as Winner and Valvole Italia, are competitors who have emerged in low-cost production regions that will typically attempt to copy our products and like products designed by competitors. Low-cost producers generally have a limited product range compared with full line or cartridge valve and quick release coupling only producers, which restricts their ability to be competitive.
11
We believe that we compete based upon the quality, reliability, value, speed of delivery and technological characteristics of our products and services.
Electronics
Competition within the electronics market is very broad with competitors ranging from large multinational companies with full electronics offerings such as Continental, Garmin, and Bosch, to small niche companies that specialize in one product type. Enovation Controls is a niche player in the displays, controllers, gauges and instrumentation panel markets. Balboa Water Group is a niche player providing single source control and water flow systems in the health and wellness industry.
The market for products designed and manufactured by Enovation Controls is relatively fragmented with approximately the top five companies comprising the majority of the market, mostly servicing the automotive space. Enovation Controls differentiates itself through product quality and ruggedness, customization ability and service with a focus on mid-sized niche markets that are not well served by the large competitors. Our engagement and speed to market set us apart from larger competitors.
Balboa Water Group, including Joyonway, is the largest supplier of integrated end-to-end solutions for the therapy and wellness spa and bath market and is the only supplier capable of providing the full spectrum of components, from controls and displays to pumps and jets. By providing integrated architecture of hardware and software that is customized to match OEM product specifications, Balboa Water Group creates a value proposition making it difficult to easily switch suppliers.
Our overall position in our key markets is defensible due to high barriers to switching suppliers, such as up-front engineering and programming costs and positive perceptions among core customers on key selection criteria, including quality and service.
Human Capital
We consider our employees as essential contributors to our success. Our primary emphasis is on acquiring and keeping talented individuals, fostering their growth through initiatives that not only improve technical expertise but also bolster leadership, communication, and collaboration skills. These efforts contribute to cultivating a high-performance, team-oriented culture at Helios. We are dedicated to building an inclusive workforce, and our commitment to shared values such as accountability, integrity, inclusion, innovation, and leadership creates an inviting environment for our colleagues and their ideas.
At the end of our 2024 fiscal year, we employed over 2,500 colleagues worldwide. Approximately 54% of our employees are located in the Americas region, 26% in the EMEA region and 20% in APAC. In addition, we have a committed service agreement with a third party that currently supports nearly 525 jobs in Mexico and serves as an integral part of our supply chain. This agreement provides operational flexibility, allowing us to adjust staffing based on market demand. Beyond our core workforce, we also engage consultants, independent contractors, and temporary workers to supplement our capabilities as needed.
Helios is committed to fostering an inclusive and respectful work environment. Our employees adhere to our Shared Values and Code of Business Conduct and Ethics, ensuring mutual respect, dignity, and a workplace free from discrimination or harassment. We actively promote initiatives throughout our organizational culture to ensure equal opportunities for all. Leadership and employees alike are dedicated to truth, transparency, and collaboration, extending these principles to our global communities and workforce.
12
Our people strategy is designed to enhance employee engagement, develop talent, and leverage technology to attract and retain a skilled workforce. To support these goals, we have implemented impactful training programs designed to foster a shared framework and common language for collaboration across our global teams. Furthermore, the recent launch of our Leadership Academy marks a significant investment in developing future leaders across the globe. This six-month program integrates in-person and virtual training to build leadership skills, encourage collaboration, and empower participants to drive team growth and development. This initiative is the first of many planned leadership programs aligned with our long-term objectives.
Employee safety and well-being remain paramount. All Helios entities adhere to stringent environmental, health, and safety policies designed to protect both our workforce and the public. Many of our facilities feature onsite medical clinics for employees and their families, complemented by health and wellness programs that emphasize preventive care. In addition, our confidential Employee Assistance Program provides professional counseling and support for employees and their families.
In Italy, approximately 540 of our employees are represented by a union. We maintain constructive and productive relationships with union leaders, engaging in regular dialogue to ensure alignment and address workforce needs. To the best of our knowledge, there are no pending or threatened labor disputes, strikes, or work stoppages affecting the Company.
Helios remains committed to building a future-ready workforce. We continue to invest in talent development, foster inclusivity, and uphold the highest standards of employee safety and engagement. These efforts are essential to sustaining our growth, driving innovation, and delivering long-term value to our stakeholders.
Patents and Trademarks
In addition to trade secrets, unpatented know-how and other intellectual property rights, we own approximately 300 active patents and trademarks relating to certain of our products and businesses. We believe that the growth of our business is dependent upon the quality and functional performance of our products and our relationship with the marketplace, rather than on any single patent, trademark, copyright or other item of intellectual property or group of patents, trademarks or copyrights. However, our patents are important in the defense of our intellectual property from competitors who exploit product development that is not otherwise legally protected by its creator. While our patents, trademarks, copyrights and other items of intellectual property are important to us, the loss of any one item of intellectual property would not materially affect our business, taken as a whole.
Governmental Regulations
We are subject to a variety of federal, state and local laws and regulations, including in foreign jurisdictions, relating to our business practices, labor and employment, construction, land use and taxation, among others. These laws and regulations are complex, change frequently and have become more stringent over time. Compliance with government regulations, including environmental regulations, has not had a material effect on our capital expenditures, earnings or competitive position, and based on current information and the applicable laws and regulations currently in effect, is not expected to. However, laws and regulations that impose significant operational restrictions and compliance requirements upon our company can be changed, accelerated or adopted, which could negatively impact our operating results. See Item 1A - Risk Factors.
Anti-Corruption and Anti-Bribery Laws and Regulations
We are subject to the U.S. Foreign Corrupt Practices Act (“FCPA”) and anti-corruption laws, and similar laws in foreign countries, such as the U.K. Anti-Bribery Act of 2010. Any violation of these laws by us or our agents or distributors could create substantial liability for us, subject our officers and directors to personal liability, and cause a loss of reputation in the market. Increased business in higher risk countries could subject us and our officers and directors to increased scrutiny and increased liability. In addition, becoming familiar with and implementing the infrastructure necessary to comply with laws, rules and regulations applicable to new business activities and mitigating and protecting against corruption risks could be quite costly.
13
Export Controls and Trade Policies
We are subject to numerous domestic and foreign regulations relating to our operations worldwide. In particular, we are subject to trade and import and export regulations in multiple jurisdictions, including sanctions administered by the Office of Foreign Asset Controls of the U.S. Treasury Department ("OFAC"). Our businesses may also be impacted by additional domestic or foreign trade regulations ensuring fair trade practices, including trade restrictions, tariffs and sanctions, including the recently announced and potentially contemplated tariffs by the new U.S. presidential administration.
Environmental Regulations
Our operations and properties are subject to laws and regulations relating to environmental protection, including those governing air emissions, water discharges, waste management and workplace safety. We use, generate and dispose of hazardous substances and waste in our operations and could be subject to material liabilities relating to the investigation and clean-up of contaminated properties and related claims. We are required to conform our operations and properties to these laws and adapt to regulatory requirements in countries in which we operate as these requirements change. In connection with our acquisitions, we may assume significant environmental liabilities, some of which we may not be aware of, or may not be quantifiable, at the time of acquisition. In addition, new laws and regulations, the discovery of previously unknown contamination or the imposition of new requirements could increase our costs or subject us to new or increased liabilities.
Occupational Health and Safety Regulations
The Company's operations are subject to extensive and stringent governmental regulations including regulations related to the Occupational Safety and Health Act (“OSHA”) and similar safety and health regulations promulgated in other countries. The Company's employees in its manufacturing facilities operate complicated machinery that may cause substantial injury or death upon malfunction or improper operation. The Company's manufacturing locations are subject to the workplace safety rules and regulations of OSHA, local safety and health laws, and similar regulations promulgated in other countries. The Company believes that it is in compliance with the requirements of these laws. However, in the event that the Company is unable to comply with OSHA or other environmental requirements, the Company could be subject to substantial sanctions, including restrictions on its business operations, monetary liability and criminal sanctions, any of which could have a material adverse effect upon the Company's business.
Sustainability
Corporate responsibility and sustainability are reflected in the Company’s business strategy. The Board of Directors has oversight over, and recently reviewed, the Company’s principles of corporate and social responsibility. The Company is committed to reducing emissions, recycling and minimizing its environmental footprint and has implemented several strategies to achieve these goals. The Company is also fully committed to the safety of its employees and the safety of those who use its products. The Board and its committees will continue to assist the Company in its oversight of corporate social responsibilities, significant public policy issues, health and safety and environmental related trends.
Available Information
Our annual report on Form 10-K, quarterly reports on Form 10-Q, current reports on Form 8-K and amendments to those reports, as well as our proxy statements and other materials which are filed with or furnished to the Securities and Exchange Commission (“SEC”) are made available, free of charge, on or through the Helios website under the heading “Investors” and “SEC Filings” as soon as reasonably practicable after they are filed with, or furnished to, the SEC.
The Company’s executive offices are located at 7456 16th St E, Sarasota, Florida 34243, and our telephone number is (941) 362-1200. Our website is www.heliostechnologies.com.
14
ITEM 1A. RISK FACTORS
FACTORS INFLUENCING FUTURE RESULTS - FORWARD-LOOKING STATEMENTS This Annual Report contains “forward-looking statements” (within the meaning of the Private Securities Litigation Reform Act of 1995) that are based on current expectations, estimates, forecasts, projections, our beliefs and assumptions made by us, including (i) our strategies regarding growth, including our intention to develop new products and undertake acquisitions; (ii) the effectiveness of creating the Centers of Excellence; (iii) our financing plans; (iv) trends affecting our financial condition or results of operations; (v) our ability to continue to control costs and to meet our liquidity and other financing needs; (vi) the declaration and payment of dividends; and (vii) our ability to respond to changes in customer demand domestically and internationally, including as a result of standardization. In addition, we may make other written or oral statements, which constitute forward-looking statements, from time to time. Words such as “may,” “expects,” “projects,” “anticipates,” “intends,” “plans,” “believes,” “seeks,” “estimates,” variations of such words and similar expressions are intended to identify such forward-looking statements. Similarly, statements that describe our future plans, objectives or goals also are forward-looking statements. These statements are not guarantees of future performance and are subject to a number of risks and uncertainties, including those discussed below and elsewhere in this report. Our actual results may differ materially from what is expressed or forecasted in such forward-looking statements, and undue reliance should not be placed on such statements. All forward-looking statements are made as of the date hereof, and we undertake no obligation to update any forward-looking statements, whether as a result of new information, future events or otherwise.
Factors that could cause actual results to differ materially from what is expressed or forecasted in such forward-looking statements include, but are not limited to: (i) our ability to respond to global economic trends and changes in customer demand domestically and internationally, including as a result of standardization and the cyclical nature of our business, which can adversely affect the demand for capital goods, (ii) supply chain disruption and the potential inability to procure goods; (iii) conditions in the capital markets, including the interest rate environment and the continued availability of capital on terms acceptable to us, or at all; (iv) global and regional economic and political conditions, including inflation (or hyperinflation), exchange rates, changes in the cost or availability of energy, transportation, the availability of other necessary supplies and services and recession; (v) changes in the competitive marketplace that could affect our revenue and/or cost basis, such as increased competition, lack of qualified engineering, marketing, management or other personnel and increased labor and raw materials costs; (vi) risks related to heath epidemics, pandemics and similar outbreaks, which may have material adverse effects on our business, financial position, results of operations and cash flows; (vii) risks related to our international operations, including the potential impact from ongoing geopolitical conflicts in Ukraine and the Middle East; (viii) risks related to our recent and ongoing management transitions; (ix) new product introductions, product sales mix and the geographic mix of sales nationally and internationally; (x) stakeholders', including regulators', views regarding our environmental, social and governance goals and initiatives, and the impact of factors outside of our control on such goals and initiatives; and (xi) the risk factors identified below together with other risks and uncertainties described elsewhere in this Annual Report and described from time to time in our future reports filed with the SEC.
Risks Relating to Our Business: Global Regulatory and Economic Conditions
General global economic trends and industry trends may affect our sales. The capital goods industry in general, and our businesses, are subject to economic cycles that directly affect customer orders, lead times and sales volume. Economic downturns generally have a material adverse effect on our business and results of operations. Cyclical economic expansions provide a context where demand for capital goods is stimulated, creating higher incoming order rates for the products we produce. Higher demand can lead to part shortages, which drive costs up. If demand gets too strong, lead times can be extended, which may cause some customers to cancel orders. In the future, continued weakening or improvement in the economy will directly affect orders and influence results of operations.
15
Our business could be harmed by adverse global and regional economic and political conditions, including inflation, changes in the cost or availability of energy, transportation and other necessary supplies and services, as well as the impact of tariffs. We are subject to inflationary pressures on our operating costs, including labor, costs for supplies and costs for the transportation of our products. If we are not able to reduce our exposure to, mitigate the impact of or sufficiently increase our pricing to offset an increase in costs, it could materially and adversely affect our business, operating results and profitability.
Our success is dependent, in part, on our continued ability to reduce our exposure to or mitigate the impact of increases in the cost of raw materials, finished goods, energy, transportation and other necessary supplies and services through a variety of programs, including periodic purchases, future delivery purchases, long-term contracts, sales price adjustments and certain derivative instruments, while maintaining and improving margins and market share. Also, we rely on third-party manufacturers as a source for some of our products. These manufacturers are also subject to price volatility and labor cost and other inflationary pressures, which may, in turn, result in an increase in the amount we pay for sourced products. During periods of rising prices of raw materials, there can be no assurance that we will be able to pass any portion of such increases on to customers. Conversely, when raw material prices decline, customer demands for lower prices could result in lower sale prices and, to the extent we have existing inventory, lower margins. As a result, fluctuations in raw material prices could have a material adverse effect on our business, results of operations and financial condition.
Pricing and availability of finished goods, raw materials, energy, transportation and other necessary supplies and services for use in our businesses can be volatile due to numerous factors beyond our control, including general, domestic and international economic conditions, natural disasters, labor costs, production levels, competition, consumer demand, import duties and tariffs, currency exchange rates, international treaties and changes in laws, regulations and related interpretations and global political instability (such as related to the ongoing conflicts in Ukraine and in the Middle East).
Specifically, our operations and transactions depend upon favorable trade relations between the U.S. and those foreign countries in which our customers and suppliers have operations. A protectionist trade environment in either the U.S. or those foreign countries in which we do business or sell products, such as a change in the current tariff structures, export compliance laws, government subsidies or other trade policies, may adversely affect our ability to economically source materials, sell our products, or do business in foreign markets. Trade restrictions, including withdrawal from or modification of existing trade agreements, negotiation of new trade agreements and imposition of new (and retaliatory) tariffs, including the recently announced and potentially contemplated tariffs by the new U.S. presidential administration, against certain countries or covering certain products, including developments in U.S.-China trade relations, could increase our costs, limit our ability to capitalize on current and future growth opportunities in international markets and impair our ability to expand the business. These trade restrictions, and changes in, or uncertainty surrounding, global trade policies may affect our competitive position. Our overall success as a global business depends, in part, upon our ability to succeed in differing economic, social and political conditions. We may not succeed in developing and implementing policies and strategies to counter the foregoing factors effectively in each location where we do business and the foregoing factors may cause a reduction in our sales, profitability or cash flows or cause an increase in our liabilities.
16
Failure to comply with laws, regulations and policies, including the U.S. Foreign Corrupt Practices Act and U.K. Anti-Bribery Act or other applicable anti-corruption legislation, could result in fines, criminal penalties and an adverse effect on our business. We are subject to regulation under a wide variety of U.S. federal and state and non-U.S. laws, regulations and policies, including anti-corruption laws, due to our global operations. In particular, the U.S. Foreign Corrupt Practices Act, the U.K. Bribery Act of 2010 and similar anti-bribery laws in other jurisdictions generally prohibit companies, their agents, consultants and other business partners from making improper payments to government officials or other persons (i.e., commercial bribery) for the purpose of obtaining or retaining business or other improper advantage. The laws also impose recordkeeping and internal control provisions on companies such as ours. We operate and/or conduct business, and any acquisition target may operate and/or conduct business, in some parts of the world, such as China and India, that are recognized as having governmental and commercial corruption. In such countries, strict compliance with anti-bribery laws may conflict with local customs and practices. We cannot provide assurance that our or any acquisition target’s internal control policies and procedures have protected us, or will protect us, from unlawful conduct of our employees, agents, consultants and other business partners. In the event that we believe or have reason to believe that violations of anti-corruption laws may have occurred, we may be required to investigate and/or have outside counsel investigate the relevant facts and circumstances, which can be expensive and require significant time and attention from senior management. Violation may result in substantial civil and/or criminal fines, disgorgement of profits, sanctions and penalties, debarment from future work with governments, curtailment of operations in certain jurisdictions and imprisonment of the individuals involved. As a result, any such violations may materially and adversely affect our business, results of operations or financial condition. In addition, actual or alleged violations could damage our reputation and ability to do business. Any of these impacts could have a material adverse effect on our business, results of operations or financial condition.
Our business is subject to a variety of governmental regulations that may restrict our business and may result in costs and penalties. We are subject to a variety of federal, state and local laws and regulations relating to foreign business practices, labor and employment, construction, land use and taxation, among others. These laws and regulations are complex, change frequently and have tended to become more stringent over time. Failure to comply with these laws and regulations may result in a variety of administrative, civil and criminal enforcement measures, including assessment of monetary penalties and the imposition of corrective requirements. From time to time, as part of the regular overall evaluation of our operations, including newly acquired operations, we may be subject to compliance audits by regulatory authorities. In addition, any failure to comply with regulations related to the government procurement process at the federal, state or local level, or restrictions on political activities and lobbying, may result in administrative or financial penalties. These penalties may include being barred from providing services to governmental entities, which could have a material adverse effect on our results of operations.
Our operations expose us to risks of non-compliance with numerous countries’ import and export laws and regulations. Due to our significant foreign sales, we are subject to trade and import and export regulations in multiple jurisdictions, including the U.S. Treasury Department’s Office of Foreign Assets Control’s regulations. As a result, compliance with multiple trade sanctions and embargoes and import and export laws and regulations pose a constant challenge and risk to us. Furthermore, the laws and regulations concerning import activity, export recordkeeping and reporting, export control and economic sanctions are complex and constantly changing. Any failure to comply with applicable legal and regulatory trading obligations could result in criminal and civil penalties and sanctions, such as fines, imprisonment, debarment from governmental contracts, seizure of shipments, loss of import and export privileges, reputational damage and a reduction in the value of our common stock.
17
Risks Relating to Our Business: Environmental, Health & Safety
We face various risks related to health epidemics, pandemics and similar outbreaks, which may have material adverse effects on our business, financial position, results of operations and/or cash flows. We face various risks related to health epidemics, pandemics and similar outbreaks. The spreading of any one such health outbreaks may lead to disruption and volatility in the global capital markets, which increases the cost of capital and adversely impacts access to capital. If significant portions of our workforce are unable to work effectively, including because of illness, quarantines, government actions, facility closures or other restrictions in connection with the any health epidemic, pandemic or similar outbreak, our operations would likely be impacted. We may be unable to perform fully on our contracts, and our costs may increase as a result of such health outbreaks. These cost increases may not be fully recoverable or adequately covered by insurance.
It is possible that the spreading of any health epidemic, pandemic or similar outbreak could also cause further disruption in our supply chain; cause delay, or limit the ability of customers to perform, including in making timely payments to us; impact investment performance; and cause other unpredictable events. The nature and severity of health outbreak conditions are uncertain and adverse impacts and/or the degree of the nature and severity of such conditions may vary dramatically by geography and by business. As a result, the actions we take in response to any such conditions may also vary widely by geography and by business and will likely be made with incomplete information, and may prove to be premature, incorrect or insufficient and could have a material adverse impact on our business and results of operations.
We cannot at this time predict the impact of any health outbreaks and the effect to our workforce and potential material adverse effect on our business, financial position, results of operations and/or cash flows.
Our operations are subject to environmental, health and safety laws and regulations, and we may face significant costs or liabilities associated with environmental, health and safety matters. We are subject to a variety of federal, state, local and foreign environmental, health and safety laws and regulations concerning, among other things: the discharge of pollutants into the soil, air and water; the generation, storage, handling, use, release, disposal and transportation of hazardous materials and wastes; environmental cleanup; and the health and safety of our employees. Environmental, health and safety laws and regulations continue to evolve, and we may become subject to increasingly stringent environmental standards in the future, particularly related to air quality and water quality, which could require us to make changes to our operations or incur significant costs relating to compliance. We are also required to obtain and maintain environmental, health and safety permits and approvals for our facilities and operations. In addition, the potential impacts of climate change on our operations are highly uncertain. Although the financial impact of these potential changes is not reasonably estimable at this time, our operations in certain locations and those of our customers and suppliers could potentially be adversely affected, which could adversely affect our sales, profitability and cash flows. Our failure to comply with such laws, regulations, permits and approvals could subject us to increased employee healthcare and workers’ compensation costs, liabilities, fines and other penalties or compliance costs, and could have a material adverse effect on our business, financial condition and results of operations.
Climate change and increased focus by governmental and non-governmental organizations and customers on sustainability issues, including those related to climate change, may adversely affect our business and financial results. Scientists have concluded that increasing concentrations of greenhouse gases in the Earth’s atmosphere may produce climate changes that have significant physical effects, such as increased frequency and severity of storms, droughts, floods, wildfires and other climatic events. Increased frequency of extreme weather could cause increased incidence of disruption to the production and distribution of our products at these locations. Increasing natural disasters in connection with climate change could also be a direct threat to our third-party vendors, service providers or other stakeholders, including disruptions on supply chains or information technology or other necessary services for our operations.
18
Federal, state and local governments, as well as some of our customers, are beginning to respond to climate change issues. This increased focus on sustainability may result in new legislation or regulations and customer requirements that could negatively affect us as we may incur additional costs or be required to make changes to our operations in order to comply with any new regulations or customer requirements. Legislation or regulations that potentially impose restrictions, caps, taxes or other controls on emissions of greenhouse gases such as carbon dioxide, a by-product of burning fossil fuels such as those used in our supply chain, could adversely affect our operations and financial results.
More specifically, legislative, or regulatory actions related to climate change could adversely impact Helios by increasing our fuel costs and reducing fuel efficiency and could result in the creation of substantial additional capital expenditures and operating costs in the form of taxes, emissions allowances, or required equipment upgrades. Any of these factors could impair our operating efficiency and productivity and result in higher operating costs. In addition, revenues could decrease if we are unable to meet regulatory or customer sustainability requirements. These additional costs, changes in operations, or loss of revenues could have a material adverse effect on our business, financial condition and results of operations.
Risks Relating to Our Business: Growth Strategy
We are subject to various risks relating to our growth strategy. In pursuing our growth strategy, we intend to expand our presence in existing markets, enter new markets and pursue acquisitions and joint ventures to complement our business. Many of the expenses arising from expansion efforts may have a negative effect on operating results until such time, if at all, that these expenses are offset by increased revenues. We cannot assure that we will be able to improve our market share or profitability, recover our expenditures or successfully implement our growth strategy.
The expansion strategy also may require substantial capital investment for the construction of new facilities and their effective operation. We can give no assurance that additional financing will be available on terms favorable to us, or at all.
We may fail to successfully acquire or integrate companies that provide complementary products or technologies. A key component of our growth strategy and financial goals depends upon our ability to successfully identify and integrate acquisition targets that complement our existing products and services. Such a strategy involves the potential risks inherent in assessing the value, strengths, weaknesses, contingent or other liabilities and potential profitability of acquisition candidates, as well as integrating the operations of acquired companies. In addition, any acquisitions of businesses with foreign operations or sales may increase our exposure to risks inherent in doing business outside the U.S. From time to time, we may have acquisition discussions with potential target companies both domestically and internationally. Future acquisitions may or may not occur and, if an acquisition does occur, it may not be successful in enhancing our business for one or more of the following reasons:
Inherent in any future acquisition is the risk of transitioning company cultures and facilities. The failure to efficiently and effectively achieve such transitions could increase our costs and decrease our profitability.
19
We also may incur significant costs such as transaction fees, professional service fees and other costs related to future acquisitions, as well as integration-related costs following the completion of any such acquisitions. Although we expect that the realization of efficiencies related to the integration of any acquired businesses will offset the incremental transaction and acquisition-related costs over time, this net financial benefit may not be achieved in the near term, or at all.
We are subject to intense competition. Our products currently, and will continue to, face significant competition, both from other companies and from incumbent technologies and will continue to do so in the future. We believe that we contend with our competitors based upon quality, reliability, price, value, speed of delivery and technological characteristics. However, we cannot provide assurance that we will continue to be able to compete effectively with these companies.
Currently, certain of our customers purchase parts or products from us to meet a specific need in a system that cannot be filled by a component that they make themselves. However, given their superior technological capabilities and financial resources, our competitors could be engaged in the internal development of products and technologies that are similar to, or may compete with, certain of our products and technologies.
The future prospects for our products are dependent upon our customers’ acceptance of our products as an alternative to their internally developed products. They also may decide to develop or acquire products that are similar to, or that may be substituted for, our products.
We also sell products into competitive markets. Within our primary markets, we compete with a range of companies that offer certain individual components of our full system solutions. Particularly within our Electronics segment, the components of our overall systems most commonly include displays, panels, sensors, valves and other end-devices. If our customers fail to accept our full system products or seek to internally develop alternatives to our full system products using component parts sourced from our competitors, or if we are otherwise unable to develop or maintain strong relationships with our customers, our business, financial condition and results of operations would be materially and adversely affected.
Competitive actions, such as price reductions, consolidation in the industry, improved delivery, more successful utilization of data and other emerging technologies, like artificial intelligence, and other actions, could adversely affect our revenue and earnings. We could experience a material adverse effect to the extent that our competitors are successful in reducing our customers’ purchases of products and services from us. Competition could also cause us to lower our prices, which could reduce our margins and profitability.
Risks Relating to Our Business: Operations
A disruption in our supply chain or other factors impacting the distribution of our products could adversely affect our business. A disruption within our logistics or supply chain network at any of the freight companies that deliver components for our manufacturing operations or ship our products to our customers could adversely affect our business and result in lost sales or harm to our reputation. Our supply chain is dependent on third-party ocean-going container ships, rail, barge and trucking systems and, therefore, disruption in these logistics services because of weather-related problems, strikes, geopolitical conflicts, bankruptcies or other events could adversely affect our financial performance and financial condition, negatively impacting sales, profitability and cash flows. Additionally, we rely on supplied labor through a third-party provider to support key operations in Mexico. A disruption in the ability of this provider to deliver qualified personnel and to operate our facility in Mexico could have a material adverse effect on our business, financial condition and operating results.
In addition, supply shortages for a particular type of material can delay production or cause increases in the cost of manufacturing our products. If these shortages were to be prolonged or expanded in scope, there could be significant impact on our ability to manufacture and to deliver our products. Accordingly, such impact on our manufacturing operations and delivery limitations could have a material adverse effect on our business, financial condition, results of operations and cash flows.
20
If we are unable to continue our technological innovation and successful introduction of new commercial products in an efficient, cost-effective manner, our business will be adversely affected. Our business involves a significant level of product development activities. Industry standards, customer expectations or other products may emerge that could render one or more of our products or services less desirable or obsolete. Maintaining our market position requires continued investment in research and development (“R&D”). Our future growth will depend on our ability to gauge the direction of the commercial and technological progress in our markets, as well as our ability to acquire new product technologies or to fund and successfully develop, manufacture and market products in this constantly changing environment. During an economic downturn or a subsequent recovery, we may need to maintain our investment in R&D, which may limit our ability to reduce these expenses in proportion to a sales shortfall. In addition, increased investments in R&D may divert resources from other potential investments in our business, such as acquisitions or investments in our facilities, processes and operations. If these activities are not as successful as currently anticipated, are not completed on a timely basis or are more costly than currently anticipated, or if we are not able to produce newly developed products at a cost that meets the anticipated product cost structure, then our future sales, margins and/or earnings could be lower than expected, which could have a material adverse effect on our business, financial condition, results of operations and cash flows. Further, if we fail to keep pace with evolving technological innovations in the markets we serve, our business will be adversely affected.
We are subject to fluctuations in the prices of parts and raw materials and are dependent on our suppliers of these parts. We are dependent upon suppliers for parts and raw materials used in the manufacture of components that we sell, and some of our raw material costs are subject to commodity market price fluctuations. We may experience an increase in costs for parts or raw materials that we source from our suppliers, or we may experience a shortage of parts or raw materials for various reasons, such as the loss of a significant supplier, high overall demand creating shortages in parts and supplies we use, financial distress, work stoppages, natural disasters, fluctuations in commodity prices or production difficulties that may affect one or more of our suppliers. In particular, current or future global economic uncertainty may affect our key suppliers in terms of their operating cash flow and access to financing. This may, in turn, affect their ability to perform their obligations to us. In addition, quality and sourcing issues that our suppliers may experience can also adversely affect the quality and effectiveness of our products and services and may result in liability or reputational harm to us. Our customers rely on us to provide on-time delivery and have certain rights if our delivery standards are not maintained. A significant increase in our supply costs, including for raw materials that are subject to commodity price fluctuations, or a protracted interruption of supplies for any reason, could result in the delay of one or more of our customer contracts or could damage our reputation and relationships with our customers. Any of these events could have a material adverse effect on our business, financial condition, results of operations and cash flows.
Unforeseen or recurring operational problems at any of our facilities, or other catastrophic loss of one of our key manufacturing facilities, may cause significant lost production and adversely affect our results of operations. Our manufacturing process could be affected by operational problems that could impair our production capability. Many of our manufacturing facilities contain high cost and sophisticated machines that are used in our manufacturing processes. Disruptions or shutdowns at any of our facilities could be caused by:
21
If some of our facilities are shut down, they may experience prolonged startup periods, regardless of the reason for the shutdown. Those startup periods could range from several days to several weeks or longer, depending on the reason for the shutdown and other factors. Any prolonged disruption in operations at any of our facilities could cause a significant loss of production and adversely affect our results of operations and negatively impact our customers and dealers.
We currently have operations located in geographies susceptible to severe weather events, such as hurricanes, floods, earthquakes and tornadoes. A catastrophic event, whether resulting from severe weather or otherwise, could result in the loss of the use of all or a portion of one of our manufacturing facilities. Although we carry property and business interruption insurance, our coverage may not be adequate to compensate us for all losses that may occur. Any of these events individually or in the aggregate could have a material adverse effect on our business, financial condition and operating results.
The transformation of our business from a holding company into an integrated operating company to improve productivity and advance product development efforts through our Centers of Excellence may not be successful in growing or enhancing our business on the timelines we suspect, or at all. Over the past few years, we began the process of transforming our operating model from a holding company to an integrated operating company with initiatives to drive growth, including "in the region, for the region" manufacturing to better align supply chain and manufacturing value streams with customers geographically to shorten lead times, reduce inventory, optimize costs, and mitigate global supply risks and establishing and expanding manufacturing centers to provide scale in North America, Asia and Europe to meet growing global demand. While the majority of the restructuring activity necessary to shift manufacturing to regional operational Centers of Excellence has been completed, there still remains additional transfers, integration activities and efficiency efforts. These restructuring activities may not be substantially completed in the expected timeframe or at all, may be more costly to implement than expected, or may not fully achieve the anticipated benefits for the business. Furthermore, such initiatives involve a significant amount of capital expenditures, organizational change and execution risk, which could have a negative impact on employee engagement, divert management’s attention from other initiatives, and if not properly managed, impact our ability to retain key employees, cause disruptions in our day-to-day operations and have a negative impact on our financial results.
Risks Relating to Our Business: Financial
We may need additional capital in the future, and it may not be available on acceptable terms, or at all. We may require additional capital in the future to:
We can give no assurance that additional financing will be available on terms favorable to us, or at all. The terms of available financing may place limits on our financial and operating flexibility. If adequate funds are not available on acceptable terms, we may be forced to reduce our operations or to delay, limit or abandon expansion opportunities. Moreover, even if we are able to continue our operations, the failure to obtain additional financing could reduce our competitiveness. Our senior credit facility limits our ability to incur additional debt and therefore we likely would have to issue additional equity to raise additional capital. If we issue additional equity, a shareholder’s interest in us will be diluted.
22
Our existing indebtedness could adversely affect our business and growth prospects. As of December 28, 2024, we had total indebtedness of approximately $451 million. Our indebtedness, or any additional indebtedness we may incur, could require us to divert funds identified for other purposes for debt service and impair our liquidity position. If we cannot generate sufficient cash flow from operations to service our debt, we may need to refinance our debt, dispose of assets or issue equity to obtain necessary funds. We do not know whether we would be able to take any of these actions on a timely basis, on terms satisfactory to us or at all.
Our indebtedness, the cash flow needed to satisfy our debt and the covenants contained in our senior credit facility have important consequences, including:
More specifically, under the terms of our senior credit facility, we have agreed to certain financial covenants. In addition, our senior credit facility places limitations on our ability to acquire other companies. Any failure by us to comply with the financial or other covenants set forth in our senior credit facility in the future, if not cured or waived, could result in our senior lender accelerating the maturity of our indebtedness or preventing us from accessing availability under our senior credit facility. If the maturity of our indebtedness is accelerated, we may not have sufficient cash resources to satisfy our debt obligations and we may not be able to continue our operations as planned.
If our long-lived assets, goodwill or other intangible assets become impaired, we may be required to record significant non-cash charges to our earnings. We recognize impairments of goodwill when the fair value of any of our reporting units becomes less than its carrying value. Our estimates of fair value are based on assumptions about future cash flows of each reporting unit, discount rates applied to these cash flows and current market estimates of value. Based on the uncertainty of future revenue growth rates and other assumptions used to estimate our reporting units’ fair value, future reductions in our expected cash flows could cause material non-cash impairment charges, which could have a material adverse effect on our results of operations and financial condition. We also have certain long-lived assets and other intangible assets which could be at risk of impairment or may require reserves based upon anticipated future benefits to be derived from such assets. Any change in the valuation of such assets could have a material effect on our profitability. Goodwill makes up 33.1% of total assets as of December 28, 2024. Reference the Critical Accounting Policies and Estimates section for additional considerations.
Fluctuations in exchange rates may affect our operating results and impact our financial condition. Fluctuations in the value of the U.S. dollar may increase or decrease our sales or earnings. Because our consolidated financial results are reported in U.S. dollars, when we generate sales or earnings in other currencies, or we pay expenses in other currencies, the translation of those results into U.S. dollars can result in a significant increase or decrease in the reported amount of those sales or earnings. If the U.S. dollar strengthens relative to the value of the local currency, we may be less competitive. In addition, our debt service requirements are predominantly in U.S. dollars and a portion of our cash flow is generated in Chinese yuan, Australian dollar, British pounds, Euros and other foreign currencies. Significant changes in the value of the foreign currencies relative to the U.S. dollar could impair our cash flow, results of operations and financial condition.
23
In addition, fluctuations in currencies relative to the U.S. dollar may make it more difficult to perform period-to-period comparisons of our reported results of operations. For purposes of accounting, the assets and liabilities of our foreign operations, where the local currency is the functional currency, are translated using period-end exchange rates, and the revenues and expenses of our foreign operations are translated using average exchange rates during each period.
In addition to currency translation risks, we incur currency transaction risk whenever we enter into either a purchase or a sales transaction using a currency other than U.S. dollars. Given the volatility of exchange rates, we may not be able to effectively manage our currency or translation risks. Volatility in currency exchange rates may decrease our sales and profitability and impair our financial condition. We periodically evaluate our need to hedge our exposures to foreign currencies and enter into forward foreign exchange contracts as we deem necessary, which contracts may not adequately hedge our exposure to foreign currencies.
Changes in tax rates, laws or regulations and the resolution of tax disputes could adversely impact our financial results. As a global company, we are subject to taxation in the U.S. and numerous non-U.S. jurisdictions. Significant judgment is required to determine our consolidated income tax provision and related liabilities. The Company’s effective tax rate, cash flows and operating results could be affected by changes in the mix of earnings in countries with different statutory tax rates, as well as by changes in the local tax laws and regulations, or the interpretations thereof. In addition, the Company’s tax returns are subject to regular review and audit by U.S. and non-U.S. tax authorities. While we believe our tax provisions are appropriate, the final outcome of tax audits or disputes could result in adjustments to the Company’s tax liabilities, which could adversely affect our financial results.
Risks Relating to Our Business: Intellectual Property
The inability to protect our intellectual property could reduce or eliminate any competitive advantage and reduce our sales and profitability, and the cost of protecting our intellectual property may be significant. We have obtained and applied for some U.S. and foreign trademark and patent registrations and will continue to evaluate the registration of additional trademarks and patents, as appropriate. We cannot guarantee that any of our pending patent and trademark applications will be approved. Moreover, even if the applications are approved, third parties may seek to oppose or otherwise challenge them. An inability to obtain registrations in the U.S. or elsewhere could limit our ability to protect our trademarks and technologies and could impede our business. Further, the protection of our intellectual property rights may require expensive investment in protracted litigation and substantial management time, and there is no assurance we ultimately would prevail or that a successful outcome would lead to an economic benefit that is greater than the investment in the litigation. In the Electronics segment, the patents in our portfolio are scheduled to expire at various dates through 2041. In the Hydraulics segment, the patents in our portfolio are schedule to expire at various dates through 2054.
We may also face difficulties protecting our intellectual property rights in foreign countries. The laws of foreign countries in which our products are sold or manufactured may not protect our intellectual property rights to the same extent as the laws of the U.S. For example, we are attempting to increase our technical capabilities and sales in China, where laws may not afford the same intellectual property protections.
24
If we are alleged to have infringed upon the intellectual property rights owned by others, our business and results of operations could be materially adversely affected. Competitors or other third parties may allege that we, or consultants or other third parties retained or indemnified by us, infringe on their intellectual property rights. We also may face allegations that our employees have misappropriated intellectual property rights of their former employers or other third parties. From time to time, we receive notices from other companies that allege we may be infringing certain of their patents or other rights. If we are unable to resolve these matters satisfactorily, or to obtain licenses on acceptable terms, we may face litigation. Given the potential risks and uncertainties of intellectual property-related litigation, the assertion of an infringement claim against us may cause us to spend significant amounts to defend the claim (even if we ultimately prevail), pay significant money damages, lose significant revenues, be prohibited from using the relevant technologies or other intellectual property rights, cease offering certain products or services, or incur significant license royalty, or technology development expenses. Even in instances where we believe that claims and allegations of intellectual property infringement against us are without merit, defending against such claims is time consuming and expensive and could result in the diversion of time and attention of our management and employees. In addition, although in some cases a third party may have agreed to indemnify us for such costs, such indemnifying party may refuse or be unable to uphold its contractual obligations.
If we are unable to protect the confidentiality of our trade secrets, our business and competitive position would be harmed. We maintain trade secrets, confidential and proprietary information in the course and scope of our business. In the Electronics segment particularly, we rely significantly on trade secrets such as unpatented software algorithms, know-how, technology and other proprietary information to maintain our competitive position. We seek to protect software algorithms through encryption mechanisms in the distribution of our binary files used in programming our engine control products. However, we cannot guarantee that these encryption techniques can protect all or any portion of these binary files. In practice, we seek to protect our trade secrets by entering into non-disclosure and confidentiality agreements with parties who have access to them, such as our employees, corporate collaborators, outside scientific collaborators, contract manufacturers, consultants, advisors and other third parties. The agreements obligate them to assign to us any inventions developed in the course of their work for us. However, we cannot guarantee that we have executed these agreements with each party that may have or has had access to our trade secrets or that the agreements we have executed will provide adequate protection. Despite these efforts, any of these parties may breach the agreements and disclose our proprietary information, including our trade secrets, and we may not be able to obtain adequate remedies for such breaches. As a result, we may be forced to bring claims against third parties, or defend claims that they bring against us, to determine ownership of what we regard as our intellectual property. Monitoring unauthorized disclosure is difficult and we do not know whether the procedures we have followed to prevent such disclosure are, or will be, adequate. Enforcing a claim that a party illegally disclosed or misappropriated a trade secret is difficult, expensive and time-consuming, and the outcome is unpredictable. In addition, some courts inside and outside the U.S. may be less willing or unwilling to protect trade secrets. If any of our trade secrets were to be disclosed to, or independently developed by, a competitor, our competitive position would be harmed, which could have an adverse effect on our business and financial condition.
Our use of open source software may expose us to additional risks. We use open source software in our business, including in some of our products. While we try to monitor all use of open source software in our business to ensure that no open source software is used in such a way as to require us to disclose the source code to critical or fundamental elements of our software or technology, we cannot be certain that such use may not have inadvertently occurred in deploying our solutions. Furthermore, the terms of many open source licenses have not been interpreted by U.S. courts. As a result, there is a risk that these licenses could be construed in a way that could impose unanticipated conditions or restrictions on our ability to commercialize our products. The risks associated with usage of open source software cannot be eliminated and could potentially have a material adverse effect on our business, financial condition and results of operations.
25
Risks Relating to Our Business: Other
We are dependent upon key individuals and skilled personnel. Our success depends, to some extent, upon several key individuals. The loss of the services of one or more of these individuals could have a material adverse effect on our business. We have recently experienced turnover in our senior management. We have promoted employees to fill certain roles and are conducting internal and external searches for other roles. Future operating results depend to a significant degree upon the continued contribution of key management, technical personnel and the skilled labor force. As the Company continues to expand internationally, additional management and other key personnel will be needed. Competition for management and engineering personnel is intense, and other employers may have greater financial and other resources to attract and retain these employees. We conduct our global operations in North America, Europe and Asia Pacific and through a third-party supplier in Mexico. Our continued success is dependent on our ability to attract and retain a skilled labor force at these locations. There are no assurances that we will continue to be successful in attracting and retaining the personnel required to develop, manufacture and market our products and expand our operations.
We are subject to risks relating to international sales. International sales represent a significant proportion of our consolidated sales. Approximately 53% of our net sales were outside of the U.S. in 2024 and approximately 54% in 2023. We will continue to expand the scope of operations outside the U.S., both through direct investment and distribution, and we believe that international sales will continue to account for a substantial portion of net sales in future periods.
Our future results could be harmed by a variety of factors already stated in this Risk Section as well as those below:
Our international operations and sales also expose us to different local political, regulatory and business risks and challenges. For example, we are faced with potential difficulties in staffing and managing local operations, and we have to design local solutions to manage credit and legal risks of local customers and channel partners, which may not be effective. In addition, because some of our international sales are to suppliers that perform work for foreign governments, we are subject to the political and legal risks associated with foreign government projects. For example, certain foreign governments may require suppliers for a project to obtain products solely from local manufacturers or may prohibit the use of products manufactured in certain countries.
26
International growth and expansion into markets such as Europe, Asia and Latin America may cause us difficulty due to greater regulatory barriers than in the U.S., the necessity of adapting to new regulatory systems, problems related to entering new markets with different economic, social and political systems and conditions and significant competition from the primary participants in these markets, some of which may have substantially greater resources and political influence than we do. For example, unstable political conditions or civil unrest could negatively impact our order levels and sales in a region or our ability to collect receivables from customers or operate or execute projects in a region.
Increased cybersecurity threats and more sophisticated and targeted computer crime and cybersecurity incidents could pose a risk to our data, systems, networks, products, solutions and services. We are dependent on various information technologies throughout our Company to administer, store and support multiple business activities. Increased global cybersecurity threats and some sophisticated and targeted computer crime, including new potential threats enabled by the emergence of generative artificial intelligence, pose a risk to the security of our systems and networks and the confidentiality, availability and integrity of our data. While we attempt to mitigate these risks by employing a number of measures, including employee training, comprehensive monitoring of our networks and systems and maintenance of backup and protective systems, our systems, networks, products, solutions and services remain potentially vulnerable to advanced persistent threats. Cybersecurity incidents and similar attacks vary in their form and can include the deployment of harmful malware or ransomware, denial-of-services attacks, and other attacks, which may affect business continuity and threaten the availability, confidentiality and integrity of our systems and data. Cybersecurity incidents can also include employee or personnel failures, fraud, phishing or other social engineering attempts or other methods to cause confidential information, payments, account access or access credentials, or other data to be transmitted to an unintended recipient. Cybersecurity threat actors also may attempt to exploit vulnerabilities through in software including that is software commonly used by companies in cloud-based services and bundled software. Depending on their nature and scope, such threats could potentially lead to the compromising of confidential information, improper use of our systems and networks, manipulation and destruction of data, defective products, production downtimes and operational disruptions. In addition, a cybersecurity incident or failure or disruption relating to our information or systems or that of our third-party business partners, or any failure by us or our third-party business partners to effectively address, enforce and maintain our information technology infrastructure and cybersecurity requirements may result in substantial harm to our business strategy, results of operations and financial condition, including major disruptions to business operations, loss of intellectual property, release of confidential information, alteration or corruption of data or systems, costs related to remediation or the payment of ransom, and litigation including individual claims or consumer class actions, commercial litigation, administrative, and civil or criminal investigations or actions, regulatory intervention and sanctions or fines, investigation and remediation costs and possible prolonged negative publicity, which in turn could adversely affect our reputation, competitiveness and results of operations.
Due to the nature of our business and products, we may be liable for damages based on product liability and other tort and warranty claims. We face an inherent risk of exposure to claims in the event that the failure, use or misuse of our products results, or is alleged to result, in death, bodily injury, property damage or economic loss. In the past, we have been subject to product liability claims relating to our products, and we may be subject to additional product liability claims in the future for both past and current products.
Although we currently maintain product liability coverage, which we believe to be adequate for the continued operation of our business, such insurance may become difficult or impossible to obtain in the future on terms acceptable to us. Moreover, our insurance coverage includes customary exclusions and conditions, may not cover certain specialized applications and generally does not cover warranty. A successful product liability claim or series of claims against us, including one or more consumer claims purporting to constitute class actions or claims resulting from extraordinary loss events, in excess of or outside our insurance coverage, or a significant warranty claim or series of claims against us, could materially decrease our liquidity, impair our financial condition and adversely affect our results of operations. Furthermore, regardless of the outcome, product liability claims can be expensive to defend, divert the attention of management and other personnel for significant periods of time and cause reputational damage.
27
We are subject to a variety of claims, investigations and litigation that could adversely affect our results of operations and harm our reputation. In the normal course of our business, we are subject to claims and lawsuits, including from time to time claims for damages related to product liability and warranties, investigations by governmental agencies, litigation alleging the infringement of intellectual property rights and litigation related to employee matters and commercial disputes. Defending these lawsuits and becoming involved in these investigations may divert our management’s attention, and may cause us to incur significant expenses, even if there is no evidence that our systems or components were the cause of the claim. In addition, we may be required to pay damage awards, penalties or settlements, or become subject to injunctions or other equitable remedies, that could have a material adverse effect on our business, financial condition, results of operations and cash flows. Moreover, any insurance or indemnification rights that we have may be insufficient or unavailable to protect us against potential loss exposures.
Expectations relating to environmental, social and governance considerations expose the Company to potential liabilities, increased costs, reputational harm and other adverse effects on the Company's business. Many governments, regulators, investors, employees, customers and other stakeholders are increasingly focused, occasionally in conflicting manners, on environmental, social and governance considerations relating to businesses, including climate change and greenhouse gas emissions, human capital and diversity, equity and inclusion. Responding to these environmental, social and governance considerations and implementation of these goals and initiatives involves risks and uncertainties, requires investments and are impacted by factors that may be outside the Company’s control. In addition, some stakeholders may disagree with the Company’s goals and initiatives and the focus of stakeholders may change and evolve over time. Stakeholders also may have very different views on where environmental, social and governance focus should be placed, including differing views of regulators in various jurisdictions in which we operate. Any failure, or perceived failure, by the Company to achieve its goals, further its initiatives, adhere to its public statements, comply with federal, state or international environmental, social and governance laws and regulations, or meet evolving and varied stakeholder expectations and standards could result in legal and regulatory proceedings against the Company and materially adversely affect the Company’s business, reputation, results of operations, financial condition and stock price.
Risks Relating to Our Common Stock
Future sales of our common stock in the public market or the issuance of securities senior to our common stock could adversely affect the trading price of our common stock and our ability to raise funds in new stock offerings. Sales by us or our shareholders of a substantial number of shares of our common stock in the public markets, or the perception that these sales might occur, could cause the market price of our common stock to decline or could impair our ability to raise capital through a future sale of, or pay for acquisitions using, our equity securities.
We may issue common stock or equity securities senior to our common stock in the future for a number of reasons, including to finance our operations and business strategy, as consideration in acquisitions or for other reasons. We cannot predict the effect, if any, that future sales or issuances of shares of our common stock or other equity securities, or the availability of shares of our common stock or any other equity securities for future sale or issuance, will have on the trading price of our common stock.
Additional issuances of equity securities would dilute the ownership of existing shareholders and could reduce our earnings per share. We may issue equity securities in the future in connection with capital raising activities, acquisitions, strategic transactions or for other purposes. To the extent we issue additional equity securities, the ownership of our existing shareholders would be diluted and our earnings per share could be reduced.
28
We may not pay dividends on our common stock. Holders of our common stock are only entitled to receive such dividends as our Board of Directors may declare out of funds legally available for such payments and as permitted by our debt agreements. Although historically we have paid a continuous quarterly dividend and a periodic special dividend, we are not required to declare cash dividends on our common stock, and the payment of future quarterly and special dividends is subject to the discretion of our Board of Directors. In determining the amount of any future quarterly or special dividends, our Board of Directors will consider economic and market conditions, our financial condition and operating results. Any change in our historical dividend practice could adversely affect the market price of our common stock. If our Board of Directors decides not to pay dividends in the future, then a return on investment in our common stock will only occur if our stock price appreciates.
29
ITEM 1B. UNRESOLVED STAFF COMMENTS
None.
ITEM 1C. CYBERSECURITY
Risk Management and Strategy
We utilize external standards, such as the Center for Internet Security framework, as a starting point for the design and development of our systems that assess risk and mitigation measures. Helios is committed to achieving compliance with the CIS implementation group level 2 standards. However, this does not mean that we meet any particular technical standards, specifications, or requirements, but rather we use external standards as a guide to help us identify, assess and manage cybersecurity risks and threats relevant to our business. An annual risk assessment is completed and presented to the executive leadership team and the Company’s Board of Directors. We discuss changes to our policies, procedures and processes needed to address gaps identified through the assessment.
We maintain organizational safeguards that include employee training, business continuity planning and cybersecurity insurance. These safeguards are reviewed on an annual basis or more frequently as the business environment warrants and are adjusted as needed to account for changes in the Company and overall risk environment. Cybersecurity training is delivered to employees through a combination of online modules and, where role-specific needs or circumstances warrant, instructor-led classroom sessions. This approach ensures comprehensive training tailored to the requirements of various roles while maintaining flexibility and accessibility.
We incorporate technical safeguards such as Multi-Factor Authentication (“MFA”), principles of Zero Trust and password complexity policies for all accounts to help prevent unauthorized access to our systems and data. Additionally, we utilize XDR (Extended Detection and Response) installed on endpoints, along with our Security Operations Center (“SOC”) to manage real-time endpoint protection monitoring.
No risks from cybersecurity threats nor any previous cybersecurity incidents have
30
whether and how any risks from cybersecurity threats have materially affected or are reasonably likely to materially affect the Company, including its business strategy, results of operations or financial condition, see “Risks Relating to Our Business: Other––Increased IT security threats and more sophisticated and targeted computer crime could pose a risk to our systems, networks, products, solutions and services” in Item 1A, Risk Factors.
Corporate Governance
Role of Management
Helios’ VP, Information Technology is an active member of InfraGard and has formal education in information technology with over 25-years’ experience in roles involving management of cybersecurity functions, cyber strategy, and leading and collaborating on information systems and related technologies. The VP, Information Technology receives regular updates on cybersecurity developments, results of mitigation efforts and cybersecurity incident response and remediation through monthly Advanced Threat Intelligence briefings and FBI bulletins via Infragard.
Helios information systems organization and its management team are responsible for
Role of the Helios Board of Directors
The ESG Committee addresses risks related to the global enterprise, including material risks facing the businesses, risks the Company may face in the future, measures that management has employed to address those risks and other information relating to how risk analysis is incorporated into the Company’s corporate strategy and day-to-day business operations. As part of
ITEM 2. PROPERTIES
Corporate Office
We lease office space in Sarasota, FL that is used as our corporate headquarters and customer experience center.
Segments
The table below presents information on the primary operating facilities in our Hydraulics and Electronics segments. These locations are generally used for manufacturing and distribution activities as well as sales, engineering and administrative functions.
We believe that our properties have been adequately maintained, are generally in good condition and are suitable and adequate for our business as presently conducted. The extent of utilization of our properties varies from time to time and among our facilities.
31
Hydraulics Segment |
|
||||||||||
|
Square Footage (in thousands) |
|
|||||||||
Region |
Owned |
|
|
Leased |
|
|
Total |
|
|||
Americas |
|
1,953 |
|
|
|
4 |
|
|
|
1,957 |
|
Europe |
|
116 |
|
|
|
763 |
|
|
|
879 |
|
Asia/Pacific |
|
73 |
|
|
|
236 |
|
|
|
309 |
|
Total |
|
2,142 |
|
|
|
1,003 |
|
|
|
3,145 |
|
|
|
|
|
|
|
|
|
|
|||
Electronics Segment |
|
||||||||||
|
Square Footage (in thousands) |
|
|||||||||
Region |
Owned |
|
|
Leased |
|
|
Total |
|
|||
Americas |
|
533 |
|
|
|
377 |
|
|
|
910 |
|
Europe |
|
18 |
|
|
|
7 |
|
|
|
25 |
|
Asia/Pacific |
|
— |
|
|
|
63 |
|
|
|
63 |
|
Total |
|
551 |
|
|
|
447 |
|
|
|
998 |
|
ITEM 3. LEGAL PROCEEDINGS
From time to time we are involved in routine litigation incidental to the conduct of our business. We do not believe that any pending litigation will have a material adverse effect on our consolidated financial position or results of operations.
ITEM 4. MINE SAFETY DISCLOSURE
Not applicable.
32
PART II
ITEM 5. MARKET FOR REGISTRANT'S COMMON EQUITY, RELATED STOCKHOLDER MATTERS
AND ISSUER PURCHASES OF EQUITY SECURITIES
Market Information
Our Common Stock has been trading publicly under the symbol HLIO on the New York Stock Exchange since November 1, 2021. We previously traded on the Nasdaq Global Select Market under the symbol HLIO since June 17, 2019 and prior to that under the symbol SNHY since our initial public offering on January 9, 1997.
Holders
There were 102 shareholders of record of Common Stock on February 14, 2025. The number of record holders was determined from the records of our transfer agent and does not include beneficial owners of Common Stock whose shares are held in the names of securities brokers, dealers and registered clearing agencies.
Dividends
We have historically paid regular quarterly dividends of $0.09 per share. Our Board of Directors currently intends to continue to pay a quarterly dividend of $0.09 per share during 2025. However, the declaration and payment of future dividends is subject to the sole discretion of the Board of Directors, and any determination as to the payment of future dividends will depend upon our profitability, financial condition, capital needs, acquisition opportunities, future prospects and other factors deemed pertinent by the Board of Directors.
Equity Compensation Plans
Information called for by Item 5 is provided in Note 13 of the Notes to the Consolidated Financial Statements included in this Annual Report (Item 8 of this report).
Issuer Purchases of Equity Securities
We did not repurchase any of our stock during the year ended December 28, 2024.
33
Five-Year Stock Performance Graph
The following graph compares cumulative total return among Helios, the Russell 2000 Index and the Dow Jones US Diversified Industries Index, from December 28, 2019, through December 28, 2024, assuming $100 invested in each on December 28, 2019. Total return assumes reinvestment of any dividends for all companies considered within the comparison. The stock price performance shown in the graph is not necessarily indicative of future price performance.
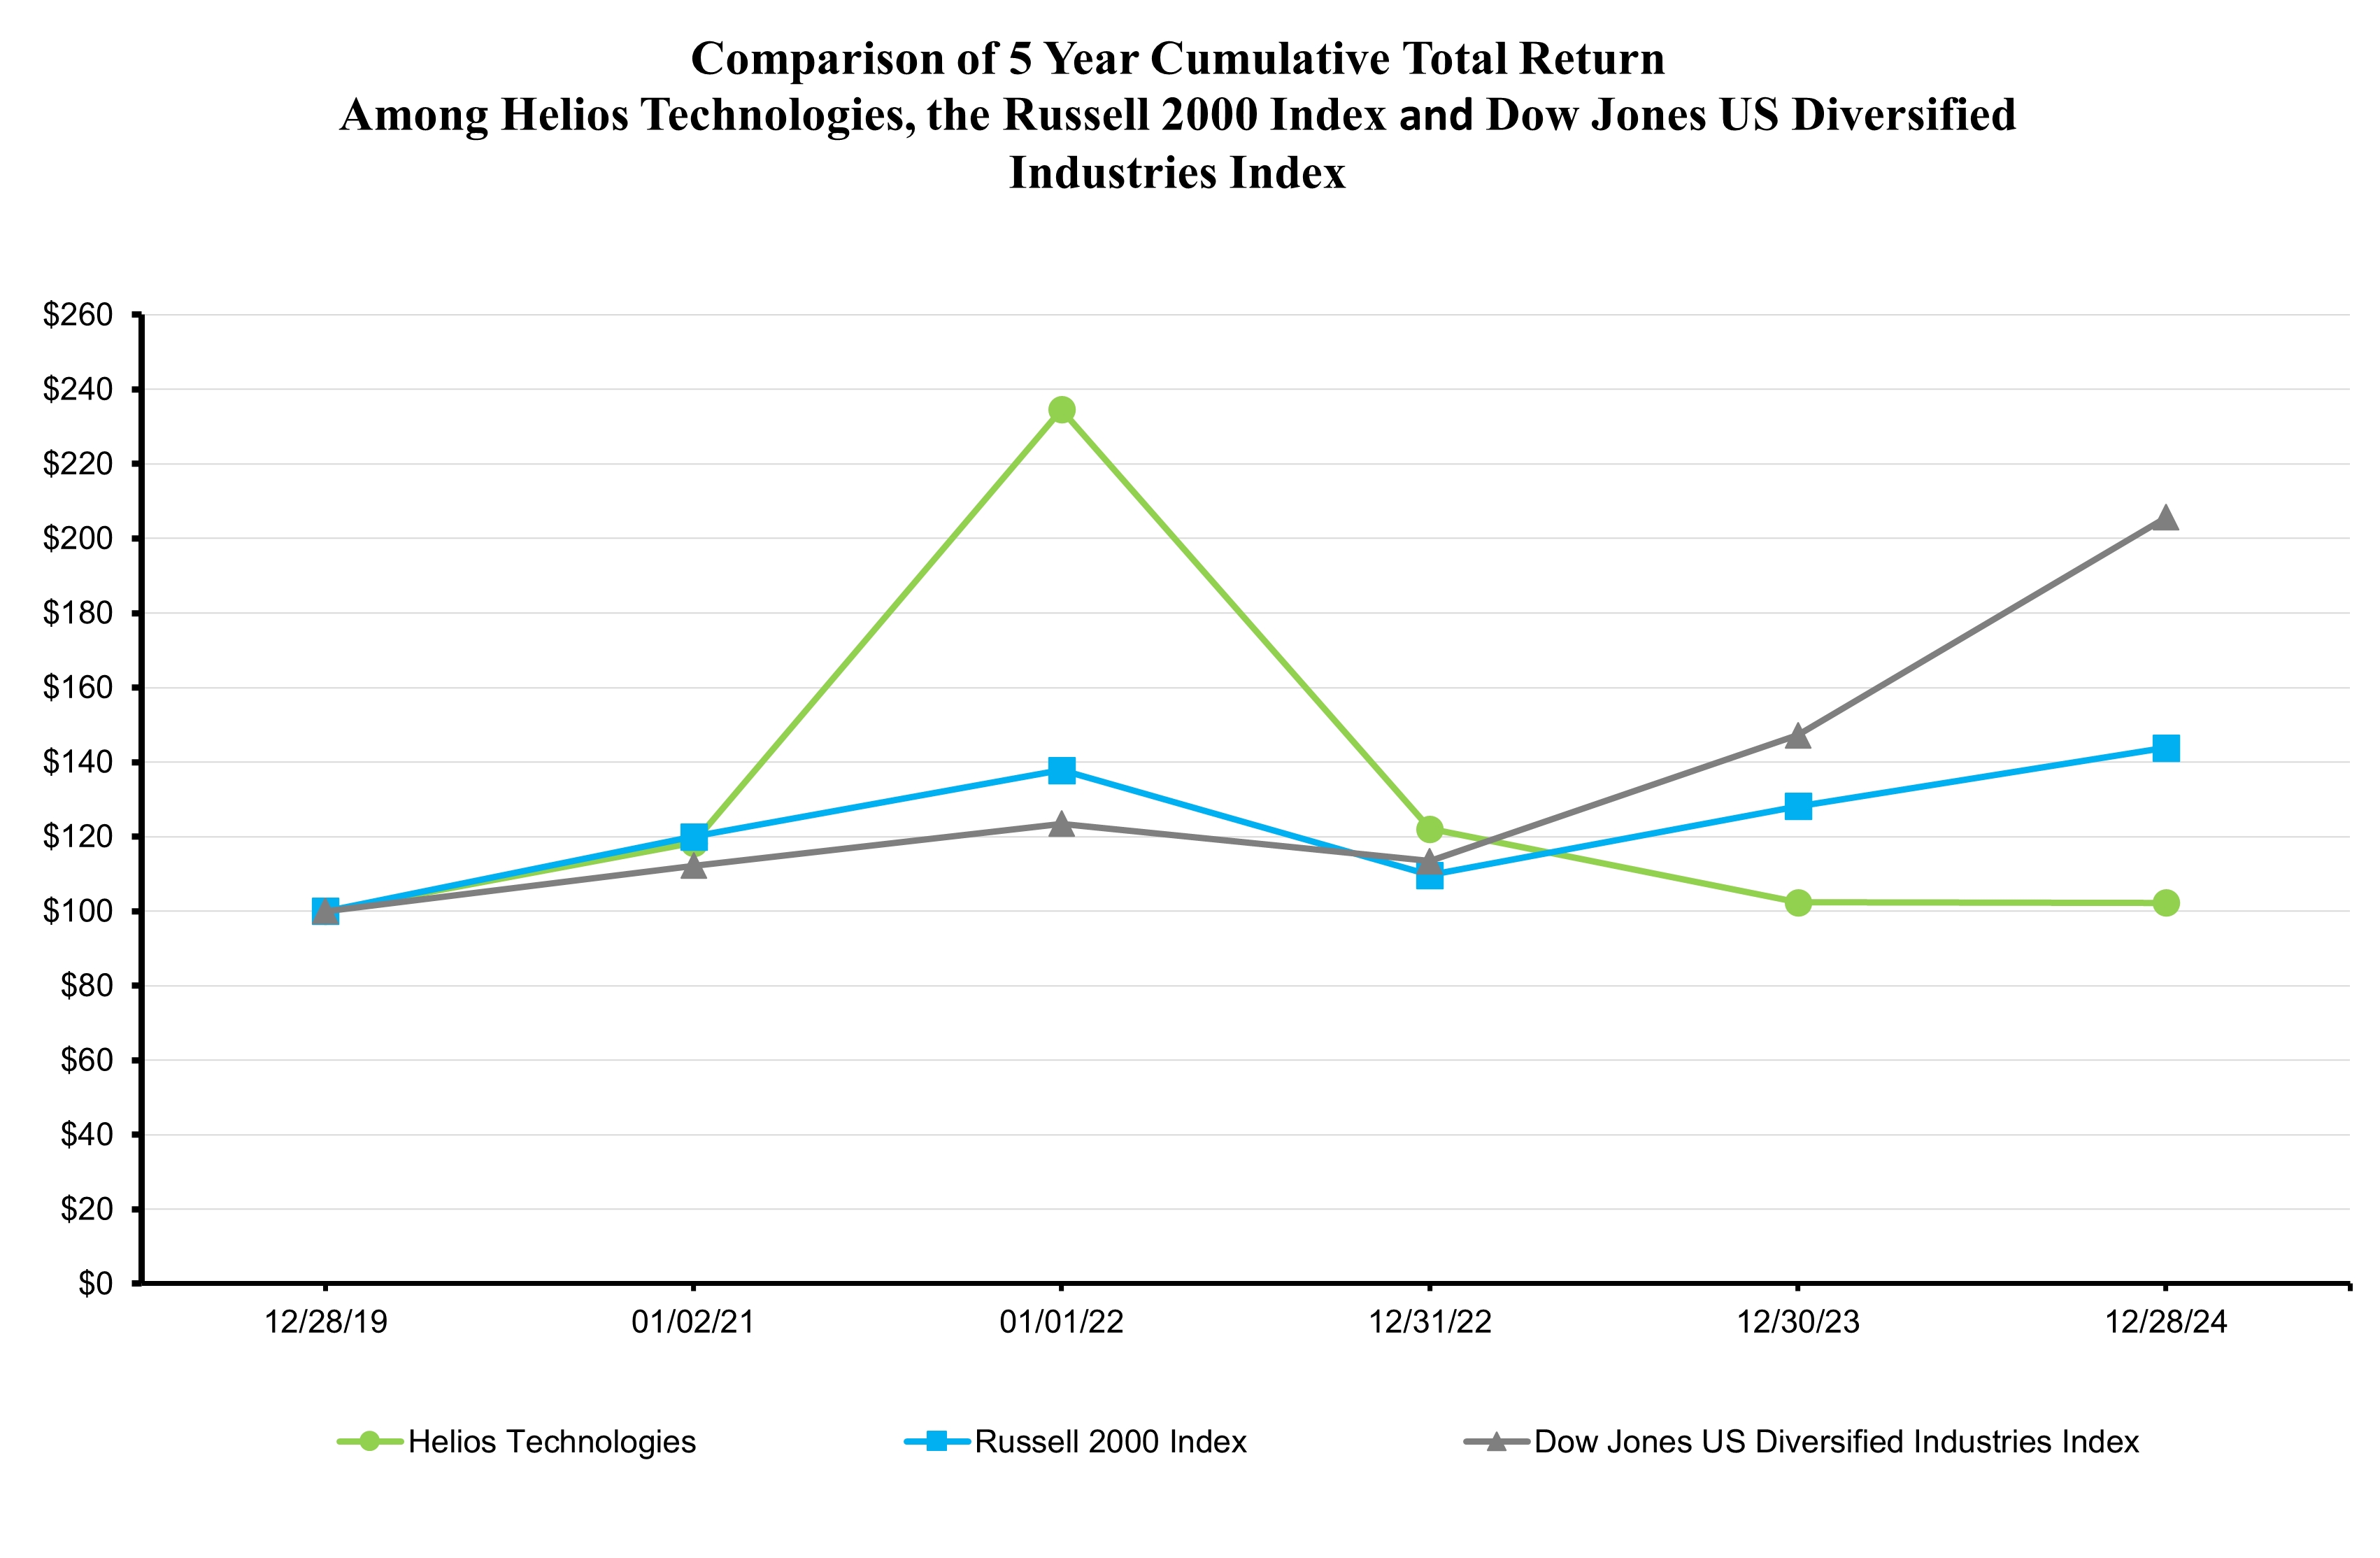
|
12/28/2019 |
|
|
1/2/2021 |
|
|
1/1/2022 |
|
|
12/31/2022 |
|
|
12/30/2023 |
|
|
12/28/2024 |
|
||||||
Helios Technologies |
$ |
100.00 |
|
|
$ |
118.24 |
|
|
$ |
234.57 |
|
|
$ |
122.04 |
|
|
$ |
102.29 |
|
|
$ |
102.27 |
|
Russell 2000 Index |
|
100.00 |
|
|
|
119.99 |
|
|
|
137.77 |
|
|
|
109.61 |
|
|
|
128.17 |
|
|
|
143.80 |
|
Dow Jones US Diversified Industries Index |
|
100.00 |
|
|
|
112.22 |
|
|
|
123.43 |
|
|
|
113.39 |
|
|
|
147.20 |
|
|
|
205.72 |
|
34
ITEM 6. [RESERVED]
35
ITEM 7. MANAGEMENT'S DISCUSSION AND ANALYSIS OF FINANCIAL CONDITION AND RESULTS OF OPERATIONS
The operating results of the Hydraulics and Electronics segments included in Management’s Discussion and Analysis of Financial Condition and Results of Operations are presented on a basis consistent with our internal management reporting. Segment information included in Note 16 of the Notes to the Consolidated Financial Statements included in this Annual Report is also presented on this basis. All differences between our internal management reporting basis and accounting principles generally accepted in the U.S. (“U.S. GAAP”), specifically the allocation of certain corporate and acquisition-related costs, are included in Corporate and Other.
Overview
We are a global leader in highly engineered motion control and electronic controls technology for diverse end markets, including construction, material handling, agriculture, industrial, mobile, energy, recreational vehicles, marine and health and wellness.
We operate under two business segments: Hydraulics and Electronics. The Hydraulics segment designs and manufactures hydraulic motion control and fluid conveyance technology products, including cartridge valves, manifolds, quick release couplings as well as engineers hydraulic solutions and in some cases complete systems. The Electronics segment designs and manufactures customized electronic controls systems, displays, wire harnesses, and software solutions for a variety of end markets.
With our global operating network we have the advantages of leveraging sales, marketing, innovation, customer relationships and operational excellence across all our businesses. We are committed to furthering the mission of integrating the businesses and leveraging resources to best serve our customers and explore new opportunities.
Acquisitions
Our acquisition activity over the past three years, driven by our strategic vision, has enabled us to diversify our product offerings and the markets we serve and expand our geographic presence.
In July 2022, we completed the acquisition of the assets of Taimi R&D, Inc., a Canadian manufacturer of innovative hydraulic components that offers ball-less design swivel products, which improve hydraulic reliability of equipment, increase the service life of components and help protect the environment by reduced leakage. Taimi brings a differentiated, yet complementary product line to our hydraulics platform as well as strong engineering breadth.
In September 2022, we completed the acquisition of Daman Products Company, headquartered in Mishawaka, Indiana. Daman is a leading designer and manufacturer of standard and custom precision hydraulic manifolds and other fluid conveyance products for its customer base, predominantly in North America. The acquisition of Daman expands the Company's technologies and markets and provides an opportunity to produce integrated package offerings with multiple Helios brands.
In January 2023, we completed the acquisition of Schultes Precision Manufacturing, Inc. Schultes is a highly trusted specialist in manufacturing precision machined components and assemblies for customers requiring very tight tolerances, superior quality, and exceptional value-added manufacturing processes. Currently serving the hydraulic, aerospace, communication, food services, medical device, and dental industries, Schultes brings the manufacturing quality, reliability, and responsiveness critical to its customers’ success. Schultes provides additional manufacturing know-how and expands our business into new end markets with attractive secular tailwinds.
In May 2023, we completed the acquisition of i3 Product Development. i3 is a custom engineering services firm, with engineers specializing in electronics, mechanical, industrial, embedded and software engineering. i3 specializes in working to transform customer’s ideas into industrial design solutions through rapid prototyping and creating 3D models in-house. Their solutions are used across many sectors, including medical, off-highway, recreational and commercial marine, power sports, health and wellness, agriculture, consumer goods, industrial, sports and fitness.
In 2024, the Company continued to explore and evaluate potential acquisitions, but no acquisitions were executed.
36
Global Economic Conditions
Geo-Political Conflict
We continue to monitor the ongoing conflicts in Ukraine and in the Middle East and evaluate the broader economic impact those conflicts could have on our operations, supply channels and the operations of our partners and customers. We do not have operations in these regions at this time and those conflicts have not and are not expected to have a material impact on our financial condition or results. Refer to Item 1A Risk Factors of this Annual Report for additional discussion about geo-political risks.
Supply Chain
While there were no impacts to operations resulting from the COVID-19 Pandemic in 2024, for comparison purposes the results in the early part of 2023 faced constraints related to sourcing certain electronic and other components, which originated from the high demand for these products caused by the pandemic. We were able to mitigate some of the impact with our procurement efforts, production schedule adjustments and product redesigns. The availability of components improved through 2023 and did not have a significant impact to results in 2024.
Industry Conditions
The capital goods industries in general, and the Hydraulics and Electronics segments specifically, are subject to economic cycles. We utilize industry trend reports from various sources, as well as feedback from customers and distributors, to evaluate economic trends. We also rely on global government statistics such as Gross Domestic Product and Purchasing Managers Index to understand higher level economic conditions.
Hydraulics
According to the National Fluid Power Association (the fluid power industry’s trade association in the U.S.), the U.S. index of shipments of hydraulic products decreased 15% in 2024, after decreasing 4% in 2023 and increasing 20% in 2022. In Europe, the CEMA Business Barometer reported in January 2025 that the general business climate index for the European agricultural machinery industry has risen further but continues in negative territory. The majority of survey participants expect incoming orders to rise in the coming six months from their current depressed levels and the confidence index for almost all European markets has improved. CEMA further reported that the direct customers of the manufacturers, the dealers, have still not been able to pass on all orders to the end customers and the dealer stocks continue with above-average levels in almost all European markets, though a considerable improvement can be seen compared to previous months. The Committee for European Construction Equipment business climate index bounced back slightly in later part of 2024 after consecutive months of decline. They reported that sales in the European market are still declining but the momentum decelerates. The expectations for next year are pretty diverse across the industry, as one third of companies anticipate a return to growth while almost the same share expects more declines to come.
Electronics
The Federal Reserve’s Industrial Production Index, which measures the real output of all relevant establishments located in the U.S., reports production of semiconductors and other electronics components declined through 2024 with an uptick at the end of December 2024. The Institute of Printed Circuits Association (“IPC”) reported that North American printed circuit board (“PCB”) shipments decreased in December 2024 by 0.3% against the same month last year following a year over year increase in November of 4.7% and a year over year decline in October of 11.1%. PCB bookings increased year over year in the last quarter with December up 59.6%, November up 29.1% and October up 3.5%. The IPC also reported that North American electronics manufacturing services (“EMS”) shipments decreased 7.8% in December 2024 compared to the same month last year following year over year increases in October and November of 14.7% and 10.6%, respectively. EMS bookings also increased year over year in the last quarter with December up 28%, November up 8.1% and October up 6.6%. The significant year over year increase in both PCB and EMS bookings were attributed to orders being pulled forward due to tariff uncertainties.
Restructuring Activities
37
During 2024, we incurred $5.2 of costs related to our restructuring activities, down from $12.1 in 2023. Restructuring activities include activities within our Hydraulics segment related to the creation of our two new Regional Operational Centers of Excellence ("CoE") which are nearing completion. We also continue to add capabilities and activities to our recently expanded Tijuana, Mexico facility to support our Electronics segment. Initial efforts have focused on circuit board assembly and wire harness production. We have also recently initiated some restructuring activities to better optimize our European regional operations. We are transitioning some manufacturing of manifolds and integrated package assembly to our Roncolo, Italy location. These activities include in part the transferring of equipment and operations between facilities. The restructuring costs are comprised of non-recurring severance and termination benefits of $2.5 and $2.7 of travel and other expenses. The restructuring plans are expected to improve the global cost structure of the business.
Executive Officer Transition
In July 2024, the Board of Directors terminated the former President and Chief Executive Officer, Josef Matosevic. Sean Bagan was immediately appointed to serve as Interim President and Chief Executive Officer in addition to his role as Chief Financial Officer, and Philippe Lemaitre as Executive Chairman in addition to his role as Chairman, while the search for a replacement was underway. On January 6, 2025, the Company announced that the Board of Directors of the Company promoted Sean Bagan to President and Chief Executive Officer of the Company, effective January 6, 2025. He will continue to serve as Chief Financial Officer while the Company conducts a search process to identify a permanent Chief Financial Officer. In connection with Mr. Bagan’s appointment, Chairman Philippe Lemaitre, serving as Executive Chairman, resumed his role as Non-Executive Chairman.
2024 Results and Comparison of Years Ended December 28, 2024 and December 30, 2023
(In millions, except per share data)
The following is a discussion of our results of operations and liquidity and capital resources for the year ended December 28, 2024; comparisons are with the corresponding reporting period of 2023, unless otherwise noted.
The following table presents our consolidated results of operations:
|
|
For the year ended |
|
|
|
|
|
|
|
|||||||
|
|
December 28, 2024 |
|
|
December 30, 2023 |
|
|
$ Change |
|
|
% Change |
|
||||
Net sales |
|
$ |
805.9 |
|
|
$ |
835.6 |
|
|
$ |
(29.7 |
) |
|
|
(3.6 |
)% |
Gross profit |
|
$ |
252.3 |
|
|
$ |
261.7 |
|
|
$ |
(9.4 |
) |
|
|
(3.6 |
)% |
Gross profit % |
|
|
31.3 |
% |
|
|
31.3 |
% |
|
|
|
|
|
|
||
Operating income |
|
$ |
81.8 |
|
|
$ |
79.9 |
|
|
$ |
1.9 |
|
|
|
2.4 |
% |
Operating income % |
|
|
10.2 |
% |
|
|
9.6 |
% |
|
|
|
|
|
|
||
Net income |
|
$ |
39.0 |
|
|
$ |
37.5 |
|
|
$ |
1.5 |
|
|
|
4.0 |
% |
Diluted net income per share |
|
$ |
1.17 |
|
|
$ |
1.14 |
|
|
$ |
0.03 |
|
|
|
2.6 |
% |
Consolidated net sales for the 2024 year declined $29.7, 3.6%. We experienced organic net sales decline of $34.7 which was partially offset by sales from acquisitions totaling $5.0. Sales were impacted most by reduced demand for products in our agriculture, mobile, industrial and recreational marine markets. These end markets experienced lower year over year demand with declines persisting through the fourth quarter. Sales to the Health and Wellness end market were up from the prior year almost 20%. As previously noted, during the Covid-19 pandemic consumers significantly invested in health and leisure products, accelerating sales in that end market. This was followed by a sharp decline in 2023. 2024 was more in line with pre-pandemic demand levels. In 2024, consolidated net sales were down in the Americas and EMEA, but up in APAC which was primarily driven by increased sales to China. There was an unfavorable impact of $0.7 on consolidated net sales from changes in foreign currency exchange rates during the year.
38
Gross profit declined $9.4, 3.6%, in 2024 driven by lower volume and higher wage and benefit costs of $6.1M partially offset by lower restructuring costs of $3.0M and lower material costs. Gross margin was flat year-over-year. Material costs as a percentage of sales, excluding targeted pricing benefits and acquisition-related sales, were down slightly year-over-year on a consolidated basis. This was offset by lower fixed overhead costs leverage on lower volume and cost impacts noted above. Changes in foreign currency exchange rates compared to 2023 reduced gross profit by $0.1.
Operating income as a percentage of sales increased 60 basis points to 10.2% in 2024 compared with the prior year period. Operating margin was favorably impacted during 2024 most significantly from lower payroll and benefit costs compared with the prior year period, which included a $5.5 reversal of unvested stock compensation in connection with the officer transition in July 2024 and lower selling, engineering and administrative ("SEA") restructuring costs of $3.9. Additionally, M&A and Integration SEA costs in 2024 were down $3.3 in 2024. These were partially offset by an increase in research and development costs of $0.9.
Net income and earnings per share (“EPS”) were favorably impacted by a contingent gain of $3.8 related to the insurance reimbursement for business interruption losses incurred in the third quarter of 2023 at a manufacturing location in Italy. They were unfavorably impacted by foreign currency transaction losses of $1.3 in 2024 compared to a loss of $0.6 in 2023. There was a slight decrease in tax expense of $0.2 and an increase in interest expense of $2.6 compared to 2023.
Segment Results
Hydraulics
The following table presents the results of operations for the Hydraulics segment:
|
|
For the year ended |
|
|
|
|
|
|
|
|||||||
|
|
December 28, 2024 |
|
|
December 30, 2023 |
|
|
$ Change |
|
|
% Change |
|
||||
Net sales |
|
$ |
537.2 |
|
|
$ |
565.8 |
|
|
$ |
(28.6 |
) |
|
|
(5.1 |
)% |
Gross profit |
|
$ |
165.8 |
|
|
$ |
181.8 |
|
|
$ |
(16.0 |
) |
|
|
(8.8 |
)% |
Gross profit % |
|
|
30.9 |
% |
|
|
32.1 |
% |
|
|
|
|
|
|
||
Operating income |
|
$ |
86.4 |
|
|
$ |
93.3 |
|
|
$ |
(6.9 |
) |
|
|
(7.4 |
)% |
Operating income % |
|
|
16.1 |
% |
|
|
16.5 |
% |
|
|
|
|
|
|
||
Net sales for the Hydraulics segment declined by $28.6, 5.1%. We experienced organic net sales decline of $30.5, 5.4%, as acquisition sales only impacted results by $1.9. Net Sales declined in 2024 due to decreased demand in the Americas and EMEA regions and significant declines in the agricultural, mobile and industrial end markets. Sales to APAC grew from prior year, primarily driven by sales to China and Australia. Discrete impacts to our organic sales included nominal favorable pricing changes of $2.2, 0.4%, and an unfavorable change in foreign currency exchange rates of $0.5, 0.1%.
The following table presents net sales based on the geographic region of the sale for the Hydraulics segment:
|
|
For the year ended |
|
|
|
|
|
|
|
|||||||
|
|
December 28, 2024 |
|
|
December 30, 2023 |
|
|
$ Change |
|
|
% Change |
|
||||
Americas |
|
$ |
219.1 |
|
|
$ |
234.4 |
|
|
$ |
(15.3 |
) |
|
|
(6.5 |
)% |
EMEA |
|
|
157.1 |
|
|
|
177.6 |
|
|
|
(20.5 |
) |
|
|
(11.5 |
)% |
APAC |
|
|
161.0 |
|
|
|
153.8 |
|
|
|
7.2 |
|
|
|
4.7 |
% |
Total |
|
$ |
537.2 |
|
|
$ |
565.8 |
|
|
|
|
|
|
|
||
In 2024, we continued and are nearing completion of our restructuring activities within our Hydraulics segment related to the creation of our two new regional operational Centers of Excellence. We also initiated some restructuring activities to better optimize our European regional operations. We incurred $4.5 of restructuring costs related to these activities including labor, travel and other expenses associated with the manufacturing relocation. $3.3 of the costs are included in cost of goods sold and $1.2 are reflected in SEA expenses.
During 2024, gross profit declined $16.0, 8.8%, from lower volume and higher direct labor costs. Gross margin declined by 120 basis points primarily due to lower fixed overhead costs leverage on lower volume and sales mix. Material costs as a percentage of sales were relatively flat, excluding pricing changes and acquisition-related sales. Changes in foreign currency exchange rates had an unfavorable impact of $0.1.
39
Operating income as a percentage of sales decreased 40 basis points to 16.1%. SEA expenses decreased $9.1, 10.3%, mainly due to lower labor and benefit costs, which includes a $3.7 reversal of unvested stock compensation in connection with the officer transition in July 2024, a reduction in research and development costs of $0.6 and a reduction in travel, professional services and other discretionary spend. SEA as a percent of sales decreased 80 basis points to 14.8% in 2024.
In the third quarter of 2023, the Company experienced aggregate losses related to a fire and a weather-related incident at one of its manufacturing locations in Italy resulting in the shut-down of operations for a period of time and disruption in production as recovery efforts ensued. Impacted operations were restored. At the end of 2024 we recorded a contingent gain related to the open insurance claims. The total reimbursement recorded was $9.1, of which $5.3 was offset against actual costs as a result of the incident and the remaining $3.8 was recorded as a gain included in Other Income. The reimbursement payments have been collected in 2025, with $1.1 million outstanding to be collected.
In October 2024, the corporate headquarters and Hydraulics segment operations located in Sarasota, Florida were impacted by Hurricane Milton. Operations were impacted for eighteen shifts leading up to and following the storm. Actual costs for cleanup, repair and labor related to the Hydraulics segment were $1.2. There were no insurance reimbursements received nor are expected to be received for this event.
Electronics
The following table presents the results of operations for the Electronics segment:
|
|
For the year ended |
|
|
|
|
|
|
|
|||||||
|
|
December 28, 2024 |
|
|
December 30, 2023 |
|
|
$ Change |
|
|
% Change |
|
||||
Net sales |
|
$ |
268.7 |
|
|
$ |
269.8 |
|
|
$ |
(1.1 |
) |
|
|
(0.4 |
)% |
Gross profit |
|
$ |
86.5 |
|
|
$ |
79.9 |
|
|
$ |
6.6 |
|
|
|
8.3 |
% |
Gross profit % |
|
|
32.2 |
% |
|
|
29.6 |
% |
|
|
|
|
|
|
||
Operating income |
|
$ |
29.6 |
|
|
$ |
24.7 |
|
|
$ |
4.9 |
|
|
|
19.8 |
% |
Operating income % |
|
|
11.0 |
% |
|
|
9.2 |
% |
|
|
|
|
|
|
||
Net sales for the Electronics segment declined by $1.1, 0.4%. We experienced organic net sales decline of $4.2, 1.6%, which was partially offset by acquisition sales of $3.1. Organic sales declined in 2024 from decreased demand in the America’s region within several of our end markets including recreational, industrial and mobile. Health and wellness increased year over year and almost offset the losses in the other end markets. The APAC region increased driven by a significant increase in sales to China. Sales in the EMEA region were relatively flat. Discrete impacts to our organic sales included pricing changes that were favorable by $2.8, 1.0%, and unfavorable changes in foreign currency exchange rates of $0.2, 0.1%.
The following table presents net sales based on the geographic region of the sale for the Electronics segment:
|
|
For the year ended |
|
|
|
|
|
|
|
|||||||
|
|
December 28, 2024 |
|
|
December 30, 2023 |
|
|
$ Change |
|
|
% Change |
|
||||
Americas |
|
$ |
215.9 |
|
|
$ |
226.5 |
|
|
$ |
(10.6 |
) |
|
|
(4.7 |
)% |
EMEA |
|
|
26.7 |
|
|
|
25.2 |
|
|
|
1.5 |
|
|
|
6.0 |
% |
APAC |
|
|
26.1 |
|
|
|
18.1 |
|
|
|
8.0 |
|
|
|
44.2 |
% |
Total |
|
$ |
268.7 |
|
|
$ |
269.8 |
|
|
|
|
|
|
|
||
In 2024, we continued and are nearing completion of our restructuring activities within our Electronics segment to shift product lines to the expanded facility in Tijuana and to adjust our labor base in line with current demand levels. We incurred $0.7 of restructuring costs including labor, travel and other expenses associated with the manufacturing relocation. $0.1 of the costs are included in cost of goods sold and $0.6 are reflected in SEA expenses.
During 2024, gross profit increased $6.6, 8.3%, primarily due to the contribution from acquisition revenues, pricing, and lower material costs. Gross margin for 2024 increased by 260 basis points primarily from lower material costs offset by the impact of a higher mix of revenue in products with a lower margin profile. Material costs as a percentage of sales decreased by 330 basis points, excluding pricing changes and acquisition-related sales.
40
Operating income as a percentage of sales decreased 180 basis points to 11.0%. SEA expenses increased $1.7, 3.1%, in 2024 primarily from acquisitions, an increase in research and development costs of $1.7, which were partially offset by the benefit of a $1.8 reversal of unvested stock compensation in connection with the officer transition in July 2024. SEA as a percent of sales increased 70 basis points to 21.2% in 2024 from 20.5% in 2023, reflecting the impact of acquisitions and increased costs referenced above.
Corporate and Other
Certain costs are excluded from business segment results as they are not used in evaluating the results of, or allocating resources to, our operating segments. For the year ended December 28, 2024, these costs totaled $34.2 and included amortization of acquisition-related intangible assets of $31.5, $1.9 related to officer transition costs and $0.8 related to other costs which was primarily acquisition and integration related activities.
For the year ended December 30, 2023, these costs totaled $38.1 and included amortization of acquisition-related intangible assets of $32.9, $4.0 related to other acquisition and integration activities and $1.2 of officer transition costs.
Interest Expense, net
Net interest expense increased $2.6 during 2024 to $33.8 compared with $31.2 in 2023. The change is attributable to higher average debt levels during 2024 and higher interest rates. Average net debt increased by $1.5 during 2024 to $448.9.
Income Taxes
The provision for income taxes for the year ended December 28, 2024, was 22.8% of pretax income compared with 23.8% for the year ended December 30, 2023. The difference relates principally to a shift in the mix of the company's worldwide income and decrease in valuation allowance established. The effective rate typically fluctuates relative to the levels of income and different tax rates in effect from year to year among the countries in which we sell our products.
The Organization for Economic Cooperation and Development (“OECD”), under its Pillar Two initiative, recently has proposed a set of Global Anti-Base Erosion (“GloBE”) rules to impose a minimum tax on income earned by multinational enterprises (“MNE”). Specifically, the GloBE rules impose a minimum tax of 15 percent on MNE income that arises in each participating jurisdiction. Several countries, including the UK and EU member states, have agreed to adopt the OECD’s minimum tax rules and several countries, including the UK, have already implemented these rules.
On December 20, 2022, the OECD published Pillar Two guidance on safe harbors and penalty relief (the “Safe Harbor Guidance”). The Safe Harbor Guidance includes a Transitional Country-by-Country Report (“CbCR”) Safe Harbor, which would deem a MNE’s top-up tax for a jurisdiction to be zero and would allow the MNE to avoid undertaking detailed GloBE calculations in respect of that jurisdiction during the Transition Period if it can demonstrate one of the three transitional tests.
The Helios Technologies Inc Group is a MNE group that is within the scope and subject to the GloBE rules. The United States has not currently made any public announcement regarding implementation of Pillar Two Framework.
The company continues to evaluate the impact of Pillar Two and application of safe harbors. For the year ended December 28, 2024, there are no impacts to income tax expense related to Pillar Two. The company does not expect it to have a material impact in 2025 to their effective tax rate.
As of December 28, 2024, the Company had approximately $37.1 million of undistributed earnings of its non-U.S. subsidiaries for which it has not provided for non-U.S. withholding taxes and state taxes because such earnings are intended to be reinvested indefinitely in international operations.
41
2023 Results and Comparison of Years Ended December 30, 2023 and December 31, 2022
For the discussion and analysis of our 2023 results compared with our 2022 results, refer to our Annual Report on Form 10-K for the fiscal year ended December 30, 2023, filed with the SEC on February 27, 2024. The discussion is incorporated herein by reference.
Liquidity and Capital Resources
Historically, our primary source of capital has been cash generated from operations. We have also used borrowings on our credit facilities to fund acquisitions. During 2024, net cash provided by operating activities totaled $122.1 and as of December 28, 2024, we had $44.1 of cash on hand and $352.4 of available credit on our revolving credit facilities. At year end 2024, approximately half of the cash on hand was held in institutions in APAC, approximately 40% was held in institutions in EMEA, and the remainder was held in institutions in the Americas. We also have a $400.0 accordion feature available on our credit facility, which is subject to certain pro forma compliance requirements and is intended to support potential future acquisitions.
Our principal uses of cash have been paying operating expenses, making capital expenditures, servicing debt, making acquisition-related payments and paying dividends to shareholders.
We believe that cash generated from operations and our borrowing availability under our credit facilities will be sufficient to satisfy our operating expenses and capital expenditures for the foreseeable future. In the event that economic conditions were to severely worsen for a protracted period of time, we would have several options available to ensure liquidity in addition to increased borrowing. Capital expenditures could be postponed since they primarily pertain to long-term improvements in operations, operating expense reductions could be made and the dividend to shareholders could be reduced or suspended.
Cash flows
The following table summarizes our cash flows for the periods:
|
|
For the year ended |
|
|
|
|
||||||
|
|
December 28, 2024 |
|
|
December 30, 2023 |
|
|
$ Change |
|
|||
Net cash provided by operating activities |
|
$ |
122.1 |
|
|
$ |
83.9 |
|
|
$ |
38.2 |
|
Net cash used in investing activities |
|
|
(30.3 |
) |
|
|
(153.9 |
) |
|
|
123.6 |
|
Net cash (used in) provided by financing activities |
|
|
(78.4 |
) |
|
|
57.9 |
|
|
|
(136.3 |
) |
Effect of exchange rate changes on cash and cash equivalents |
|
|
(1.7 |
) |
|
|
0.8 |
|
|
|
(2.5 |
) |
Net increase (decrease) in cash and cash equivalents |
|
$ |
11.7 |
|
|
$ |
(11.3 |
) |
|
$ |
23.0 |
|
Cash on hand increased $11.7 to $44.1 at the end of 2024. Cash and cash equivalents were unfavorably impacted by changes in exchange rates by $1.7 and favorably impacted by changes in exchange rates by $0.8 during the years ended December 28, 2024, and December 30, 2023, respectively. Cash balances on hand are a result of our cash management strategy, which focuses on maintaining sufficient cash to fund operations while reinvesting cash in the Company and also paying down borrowings on our credit facilities.
42
Operating activities
Net cash from operations totaled $122.1 in 2024, an increase of $38.2, 45.5%, compared with the prior year. Cash earnings, calculated as net income plus adjustments to reconcile net income to net cash provided by operating activities, excluding changes in net operating assets and liabilities, decreased by $1.0 compared to the prior year. However, changes in net operating assets and liabilities increased cash by $39.2 compared to 2023, primarily from reduction in inventories. Reductions in inventory, net of acquisitions, increased cash by $19.4 in 2024 compared with a decrease in cash by $17.9 in 2023. Inventory on hand as of December 28, 2024, decreased by $25.0, 11.6%, compared to the 2023 year end. The decrease is driven primarily by the execution of management's inventory reduction efforts and improved inventory management in response to lower sales. Days of inventory on hand increased to 134 days for the 2024 year, compared with 130 days during the 2023 year. Changes in accounts receivable, net of acquisitions, increased cash by $7.3 and $16.3 in 2024 and 2023, respectively. Days sales outstanding for the 2024 year decreased slightly to 47 days from 50 days during 2023, as our collection patterns remain consistent with the prior year. Changes in accounts payable, net of acquisitions, decreased cash by $11.8 and $5.2 in 2024 and 2023, respectively. Days payables outstanding for the 2024 year decreased to 37 days from 45 days during 2023.
Investing activities
Cash used in investing activities totaled $30.3 in 2024, a decrease of $123.6, 80.3%, compared with the prior year. The decrease in acquisition-related payments accounted for $114.2 of the fluctuation due to no acquisition-related activity in 2024. Capital expenditures were $27.0 during 2024, $7.3, or 21.3%, lower than the prior year primarily from cost deferral initiatives in 2024. Capital expenditures for 2025 are forecasted to be approximately 3.0%-4% of sales for improvements to manufacturing technology and maintaining and replacing existing machine capabilities.
Financing activities
Net cash used in financing activities totaled $78.4 in 2024, compared with net cash provided by financing activities of $57.9 in 2023. In 2024, repayments, net of borrowings, totaled $68.0. Cash paid for acquisitions in 2023 was primarily financed with borrowings on our credit facility. Borrowings, net of repayments, totaled $75.7 in 2023.
Borrowings on our term loans and revolving credit facilities as of December 28, 2024, totaled $300.3 and $150.3, respectively. See Note 10 of the Notes to the Consolidated Financial Statements included in this Annual Report for additional information regarding our credit facilities.
In connection with the debt refinancing in June 2024, while the term loan credit facility aggregate principle amount of $300.0 remained unchanged, the cash flow activity reflects repayments and borrowings on the non-revolving debt that were direct results of the refinancing. The company also incurred $3.1 of debt issuance costs in connection with the debt refinancing. These costs are captured within the Other Financing Activities caption in the Statement of Cash Flows. Additionally in June 2024, the Company received $7.1 in proceeds in connection with the termination of the interest rate swaps.
In May 2023, we entered into an incremental facility amendment to our credit agreement with PNC Bank, National Association, as administrative agent, and various lenders party thereto. With the amendment we incurred a new term loan with an aggregate principal amount of $150.0 for which the proceeds were used to repay outstanding balances on our revolving credit facility.
43
On June 25, 2024, the Company amended and restated its credit agreement (the “Third Amended and Restated Credit Agreement”) with PNC Bank, National Association, as administrative agent, and the lenders party thereto. The amendment extended the debt maturity for five years and increased the Company’s revolving credit facility (the “Revolving Credit Facility) to $500.0, with the aggregate principle amount of the term loan credit facility (the “Term Loan Facility”) remaining at $300.0. The amendment also revised the accordion feature to permit an increase of up to an additional $400.0. Borrowings under the line of credit bear interest at defined rates plus an applicable margin based on the Company’s leverage ratio. Scheduled principal payments under the Term Loan Facility are payable in quarterly installments beginning on September 28, 2024 and continuing on the last day of each following fiscal quarter, beginning at $3.75 before increasing to $5.6 in June 2026 and $7.5 in June 2028. All remaining principal and unpaid accrued interest are due on the Term Loan Facility maturity date, which is June 25, 2029.
In May 2024, $0.5 was paid to the former owners of Balboa Water Group in connection with payment due on the contingent consideration liability. The contingent consideration liability was revalued and final payment is due in 2025.
We have historically declared regular quarterly dividends to shareholders of $0.09 per share. We paid dividends totaling $11.9 and $11.8 for the years ended December 28, 2024 and December 30, 2023, respectively. The declaration and payment of future dividends is subject to the sole discretion of the Board of Directors, and any determination as to the payment of future dividends will depend upon our profitability, financial condition, capital needs, acquisition opportunities, future prospects and other factors deemed pertinent by the Board of Directors.
Contractual obligations
Credit facilities
Information on our credit facilities, including future maturities, is presented in Note 10 of the Notes to the Consolidated Financial Statements included in this Annual Report. Our revolving credit facility with PNC Bank matures and is payable in full in June 2029; however, we may make earlier payments. Our term loan with PNC Bank is payable in quarterly installments of $3.8 million through March 2026, quarterly installments of $5.6 million through March 2028 and quarterly installments of $7.5 million thereafter through the maturity date of June 2029, at which time the remaining balance will be due in full.
Interest rates on our credit facilities range from 4.9% to 7.2% as of December 28, 2024. Future interest payments are estimated to total $112.2, with annual payments ranging from $10.8 to $27.7 payable through the last maturity date of June 2029. Future payments assume the current interest rate environment, current currency exchange rates, future required payments on term loans and revolver borrowings consistent with December 28, 2024 debt levels. Future payments do not include an estimate of impacts from our derivative instruments.
Contingent consideration payments
Our contingent consideration liabilities total $0.4 as of December 28, 2024. The balance represents the fair value estimate of contractual contingent payment related to our acquisition of Balboa Water Group, which is payable in 2025.
Supplier purchases
We regularly place purchase orders with our suppliers for inventory and capital expenditures to be used in the ordinary course of business. Open purchase orders as of December 28, 2024 total $66.1 for purchases expected in 2025 and $0.4 for purchases expected in 2026.
Building purchase commitment
The Company is negotiating a lease-to-buy agreement for the purchase of a building with the option to purchase the building at any time during the lease period. Under the draft agreement, the company would commit to purchasing the building at the end of the 6-year lease term. The expected purchase price is €26.7; however, the actual purchase price will be reduced by 60% of the payments made during the lease term.
44
Leases
We regularly enter into operating lease agreements for the use of machinery, equipment, vehicles, buildings and office space. Future maturities of our operating lease liabilities are presented in Note 7 of the Notes to the Consolidated Financial Statements included in this Annual Report.
Critical Accounting Policies and Estimates
We prepare our Consolidated Financial Statements in conformity with U.S. GAAP, which requires management to make certain estimates and assumptions that affect reported amounts and related disclosures. Actual results could differ from those estimates. Management bases its estimates on historical experience and on various other assumptions it believes to be reasonable under the circumstances, the results of which form the basis for making judgments about the carrying values of assets and liabilities. The following policies are considered by management to be the most critical in understanding the judgments, estimates and assumptions that are involved in the preparation of our Consolidated Financial Statements.
Business Combinations
Business combinations are accounted for under the acquisition method of accounting, which requires recognition separately from goodwill, the assets acquired and the liabilities assumed at their acquisition date fair values. Assigning fair market values to the assets acquired and liabilities assumed at the date of an acquisition requires knowledge of current market values, and the values of assets in use, and often requires the application of judgment regarding estimates and assumptions. While the ultimate responsibility resides with management, for certain acquisitions we retain the services of certified valuation specialists to assist with assigning estimated values to certain acquired assets and assumed liabilities, including intangible assets and tangible long-lived assets. Acquired intangible assets, excluding goodwill, are valued using various methodologies such as the discounted cash flow method, which is based on future cash flows specific to the type of intangible asset purchased and the relief from royalty method, which is based on the present value of savings resulting from the right to manufacture or sell products that incorporate the intangible asset without having to pay a license for its use. These methodologies incorporate various estimates and assumptions, the most significant being estimated royalty rates, projected revenue growth rates, profit margins and forecasted cash flows based on the discount rate.
Intangible assets consist primarily of customer relationships, technology, trade names and brands and supply agreements. Amortization is on a straight-line basis over their estimated useful lives and the amortization is reflected in the Consolidated Statements of Operations. The useful lives used are as follows: Customer Relationships - 8 to 26 years; Trade Names and Brands - 10 to 20 years; Technology - 5 to 13 years; and Supply Agreements - 10 years. Intangible assets are tested for impairment if certain circumstances arise that would indicate the carrying amount of the assets may not be recoverable. Such circumstances can include, but are not limited to, a decrease in market price, economic decline, changes in the market, change in business operations or plans for disposition. The assessment of fair value for impairment purposes requires significant judgment by management, which could be negatively impacted by economic decline, market deterioration and changes in other market conditions. Additional information about intangible assets, including the gross and net carrying values for the reported periods and historical and future estimated amortization expense is presented in Note 8 of the Notes to the Consolidated Financial Statements included in this Annual Report. Additional information about our acquisitions, including acquired intangible assets deemed material to the Company’s financial results, is presented in Note 3 of the Notes to the Consolidated Financial Statements included in this Annual Report.
45
Goodwill
Goodwill represents the excess of the purchase price of an acquisition over the fair value of the net assets acquired. We test goodwill for impairment at the reporting unit level, as of the third quarter period end date, on an annual basis and between annual tests whenever events or circumstances indicate the carrying value of a reporting unit may exceed its fair value. Examples of such circumstances could include, but are not limited to, a significant loss of market share, significant decline in operating results, change in management strategy or operations, economic decline, and other such significant disruptions to the business. The carrying value of assets is calculated at the reporting unit level. An impairment loss is recorded to the extent that the fair value of the goodwill within the reporting unit is less than its carrying value.
There are multiple steps in our process for testing goodwill impairment. The first step is identification of our operating segments, followed by the identification of the reporting units, such that the reporting unit has discrete financial information, its operating results are reviewed regularly by management, and its economic characteristics are different from the economic characteristics of the other components of the operating segment., As part of the annual test of goodwill impairment the Company considers economic factors and current business operations when assessing the reporting unit structures for the purposes of goodwill impairment testing. The reporting units comprised of our four prominent businesses and the 2023 acquisition of i3.
In certain circumstances the Company may elect to test goodwill using a qualitative assessment, assessing whether it is more likely than not that the fair value of the reporting unit is less than the carrying value. More often the Company will test goodwill using the income based and market based valuation methods, as quoted market prices are not available for all reporting units. When possible, we generally use a combination of market and income approach methodologies to estimate the fair value of our reporting units. The assessment of fair value for impairment purposes requires significant judgment by management. Management’s assumptions include projected future performance, expected future costs, expected new product releases and expected future economic and market conditions (i.e. inflation, tax rates, end-market growth or decline, and expected market share performance). If these assumptions and estimates are not met or operations are impacted by other factors the reporting units could be subject to goodwill impairment.
The income approach is generally based on a discounted cash flow analysis, which estimates the present value of the projected free cash flows to be generated by the reporting unit. Assumptions used in the analysis include estimated future revenues and expenses, working capital, capital expenditures and other variables. Assumptions made for future cash flows are developed based on consideration of current and future economic conditions, recent and expected sales trends, planned timing of product launches and other relevant variables. Each reporting unit regularly prepares discrete operating forecasts and long range plans and uses these forecasts as the basis for the assumptions in the discounted cash flow analysis. Within the discounted cash flow models, the Company uses a discount rate, commensurate with its cost of capital but adjusted for inherent business risks, and an appropriate terminal growth factor.
The market approach estimates the value of reporting units by comparing to guideline public companies or guideline transactions. Various valuation multiples of companies that are economically and operationally similar are used as data points for selecting multiples for the reporting units, which are deemed to be market-adjusted multiples based on key data points for guideline public companies. Changes in assumptions or estimates could materially affect the estimated fair value of our reporting units and the potential for impairment. We also reconcile the estimated aggregate fair value of our reporting units resulting from these procedures to our overall market capitalization.
The Company completed its annual goodwill impairment testing for 2024, 2023, and 2022, and determined that the carrying amount of goodwill for each reporting unit was not impaired. In addition, in management’s assessment of reporting units for GWI testing, it was determined that the two prominent Electronics businesses share very similar economic characteristics, are operationally interdepended, and should be aggregated and tested as a single reporting unit. The test for goodwill impairment was performed for each business and for the consolidated reporting unit. Neither test indicated any impairment.
46
Given the relatively small excess fair value over the carrying value of the i3 reporting unit in 2024, less than 3%, it is at risk for possible future impairment. This goodwill value of $25.9, assumed in the May 2023 acquisition of i3, is 5.2% of the $498.9 of Goodwill as of December 28, 2024. Management is monitoring this closely but believes in the benefits that this acquisition and specifically the Cygnus software will bring to the Company in the coming years. However, if the expected benefits do not materialize due to poor economic conditions, missed operational objectives, or other such factors impacting Management’s assumptions, there could future impairment of the goodwill.
A third party was used to assist in the valuation and testing of the fair value of the reporting units. The third party provided estimates such as risk premiums, select multiples and discount rates, used in conjunction with Management’s estimates and assumptions to calculate the fair value of the reporting unit. These estimates require significant judgment. If there is economic decline, expectations for growth are not met, product launches are delayed, there is a change to management’s operating outlook, operational restructuring, or any other significant change to the assumptions, estimates or other risks previously mentioned, the reporting units could be subject to impairment.
Income Taxes
Income taxes are accounted for under the asset and liability method. Deferred tax assets and liabilities are recognized for the future tax consequences attributable to differences between the financial statement carrying amounts of existing assets and liabilities and their respective tax bases and operating loss and tax credit carryforwards. Deferred tax assets and liabilities are measured using enacted tax rates expected to apply to taxable income in the years in which those temporary differences are expected to be recovered or settled. The effect on deferred tax assets and liabilities of a change in tax rates is recognized in income in the period that includes the enactment date. To the extent the Company determines that it is more likely than not a deferred income tax asset will not be realized, a valuation allowance is established. The recoverability analysis of the deferred income tax assets and the related valuation allowances requires significant judgment and relies on estimates. At December 28, 2024, valuation allowances against deferred tax assets were $2.3 million. Refer to Note 12 of the Notes to the Consolidated Financial Statements included in this Annual Report for additional information on the composition of these valuation allowances.
Our annual tax rate fluctuates based on our income, statutory tax rates and tax planning opportunities available to us in the various jurisdictions in which we operate. Tax laws are complex and subject to different interpretations by the taxpayer and respective government taxing authorities. Significant judgment is required in determining our tax expense and in evaluating our tax positions, including evaluating uncertainties. We review our tax positions quarterly and adjust the balances as new information becomes available. Indefinite reinvestment is determined by management’s judgment about, and intentions concerning, our future operations.
We recognize and measure uncertain tax positions in accordance with ASC 740. The Company recognizes the effect of income tax positions only if those positions are more likely than not of being sustained. Recognized income tax positions are measured at the largest amount that is greater than 50% likely of being realized. Changes in recognition or measurement are reflected in the period in which the change in judgment occurs. We adjust these reserves, as well as the related interest and penalties, where appropriate in light of changing facts and circumstances. Settlement of any particular position could require the use of cash. We recognize interest and penalties, if any, related to unrecognized tax benefits in income tax expense.
See Note 12 of the Notes to the Consolidated Financial Statements included in this Annual Report for income tax amounts, including reserves.
Off Balance Sheet Arrangements
We do not engage in any off balance sheet financing arrangements. In particular, we do not have any material interest in variable interest entities, which include special purpose entities and structured finance entities.
47
ITEM 7A. QUANTITATIVE AND QUALITATIVE DISCLOSURES ABOUT MARKET RISK
We are exposed to market risk primarily from changes in foreign currency exchange rates and interest rates. To reduce such risks, we selectively use financial instruments and other proactive management techniques. All hedging transactions strictly prohibit the use of financial instruments for trading or speculative purposes. A discussion of our accounting policies for derivative financial instruments is included within Notes 2 and 9, of the Notes to the Consolidated Financial Statements included in this Annual Report.
Interest Rate Risk
Our exposure to interest rate risk results from variable debt outstanding under our term loans and revolving credit facility with PNC Bank. We pay interest on outstanding borrowings at interest rates that fluctuate based upon changes in various base rates. As of December 28, 2024, we had $150.3 million in borrowings outstanding under the revolving credit facility and $300.3 million in borrowings outstanding under the term loans. Based on our level of variable rate debt outstanding during the year ended December 28, 2024, a one percentage point increase in the reference average interest rate, which generally equaled 6.1%, would have resulted in an approximate $4.0 million increase in financing costs for the year ended December 28, 2024. This analysis excludes any effects from interest rate swap contracts as such contracts were terminated on June 25, 2024.
As of December 30, 2023, we had $199.8 million in borrowings outstanding under the revolving credit facility, $310.0 million in borrowings outstanding under the term loan and an aggregate notional amount of $220.0 million on our interest rate swap contracts. Based on our level of variable rate debt outstanding during the year ended December 30, 2023, a one percentage point increase in the reference average interest rate, which generally equaled 5.5%, would have resulted in an approximate $3.1 million increase in financing costs for the year ended December 30, 2023. This sensitivity analysis incorporates the effects of our interest rate swap contracts.
Foreign Currency Risk
Our exposure to foreign currency exchange fluctuations relate primarily, but not limited to, our locations in Italy, Australia, Germany, South Korea, the United Kingdom, China and India. Our operations in these countries are exposed to fluctuations in foreign currency rates primarily from payments received from customers, payments made to suppliers and loans denominated in foreign currencies. During the year ended December 30, 2023, we economically hedged certain foreign currency risks by entering into forward foreign exchange contracts. These contracts were not designated as hedging instruments for accounting purposes. A discussion of our accounting policies for derivative financial instruments is included within Notes 2 and 9 of the Notes to the Consolidated Financial Statements included in this Annual Report. These forward foreign exchange contracts ended in 2023 and the Company did not enter into new contracts in 2024.
The strengthening of the U.S. dollar can have an unfavorable impact on our results of operations and financial position as foreign denominated operating results are translated into U.S. dollars. The result of a 10% decrease in the 2024 average exchange rates of the currencies in which our transactions are denominated would have resulted in a decrease in annual sales of $29.5 million for the year ended December 28, 2024. The result of a 10% decrease in the 2023 average exchange rates of the currencies in which our transactions are denominated would have resulted in a decrease in annual sales of $31.5 million for the year ended December 30, 2023. This sensitivity analysis assumes that each exchange rate changed in the same direction relative to the U.S. dollar and incorporates the effects of our forward contracts. This analysis excludes the potential effects that changes in foreign currency exchange rates may have on actual sales or price levels. Similarly, a 10% decline in foreign currency exchange rates relative to the U.S. dollar on our December 28, 2024 and December 30, 2023 financial position would have resulted in a $60.0 million and $57.5 million reduction to equity (accumulated other comprehensive loss), respectively, as a result of non-U.S. dollar denominated assets and liabilities being translated into U.S. dollars, our reporting currency.
48
ITEM 8. FINANCIAL STATEMENTS AND SUPPLEMENTARY DATA
|
|
Page |
Index to financial statements: |
|
|
|
|
|
Reports of Independent Registered Public Accounting Firm (PCAOB ID Number |
|
50 |
|
|
|
Consolidated Balance Sheets as of December 28, 2024 and December 30, 2023 |
|
53 |
|
|
|
|
54 |
|
|
|
|
|
55 |
|
|
|
|
|
56 |
|
|
|
|
|
57 |
|
|
|
|
|
59 |
49
Report of Independent Registered Public Accounting Firm
Board of Directors and Shareholders
Helios Technologies, Inc.
Opinion on the financial statements
We have audited the accompanying consolidated balance sheets of Helios Technologies, Inc. (a Florida corporation) and subsidiaries (the “Company”) as of December 28, 2024 and December 30, 2023, the related consolidated statements of operations, comprehensive income, shareholders’ equity, and cash flows for each of the years ended December 28, 2024, December 30, 2023, and December 31, 2022, and the related notes (collectively referred to as the “consolidated financial statements”). In our opinion, the consolidated financial statements present fairly, in all material respects, the financial position of the Company as of December 28, 2024 and December 30, 2023, and the results of its operations and its cash flows for each of the years ended December 28, 2024, December 30, 2023, and December 31, 2022 in conformity with accounting principles generally accepted in the United States of America.
We also have audited, in accordance with the standards of the Public Company Accounting Oversight Board (United States) (“PCAOB”), the Company’s internal control over financial reporting as of December 28, 2024, based on criteria established in the 2013 Internal Control—Integrated Framework issued by the Committee of Sponsoring Organizations of the Treadway Commission (“COSO”), and our report dated February 25, 2025 expressed an unqualified opinion.
Basis for opinion
These consolidated financial statements are the responsibility of the Company’s management. Our responsibility is to express an opinion on the Company’s consolidated financial statements based on our audits. We are a public accounting firm registered with the PCAOB and are required to be independent with respect to the Company in accordance with the U.S. federal securities laws and the applicable rules and regulations of the Securities and Exchange Commission and the PCAOB.
We conducted our audits in accordance with the standards of the PCAOB. Those standards require that we plan and perform the audit to obtain reasonable assurance about whether the financial statements are free of material misstatement, whether due to error or fraud. Our audits included performing procedures to assess the risks of material misstatement of the financial statements, whether due to error or fraud, and performing procedures that respond to those risks. Such procedures included examining, on a test basis, evidence regarding the amounts and disclosures in the financial statements. Our audits also included evaluating the accounting principles used and significant estimates made by management, as well as evaluating the overall presentation of the financial statements. We believe that our audits provide a reasonable basis for our opinion.
Critical audit matters
The critical audit matter communicated below is a matter arising from the current period audit of the financial statements that was communicated or required to be communicated to the audit committee and that: (1) relates to accounts or disclosures that are material to the financial statements and (2) involved our especially challenging, subjective, or complex judgments. The communication of critical audit matters does not alter in any way our opinion on the financial statements, taken as a whole, and we are not, by communicating the critical audit matter below, providing a separate opinion on the critical audit matter or on the accounts or disclosures to which it relates.
Evaluation of the Recovery of Goodwill for Certain Reporting Units
As described further in Note 2 to the financial statements, the Company performs a test for goodwill impairment at the reporting unit level annually or more frequently, if events or changes in circumstances indicate a reduction in the fair value of goodwill below its carrying value has occurred. There were no impairment charges resulting from the impairment tests for the year ended December 28, 2024. In estimating fair value, management utilizes a combination of an income and market approach. We identified the evaluation of the recovery of goodwill for certain reporting units to be a critical audit matter.
50
The principal considerations for our determination that the evaluation of the recovery of goodwill for certain reporting units is a critical audit matter are the significant judgments by management when developing the fair value measurement and the related auditor judgement that was required to evaluate certain of management’s assumptions used in the Company’s estimate of the fair value of certain reporting units. Specifically, the growth rate used in financial projections, the related discount rate, the market multiple, control premium, and weighting applied are all assumptions requiring judgment.
Our audit procedures related to the evaluation of the recovery of goodwill for certain reporting units included the following, among others.
/s/ GRANT THORNTON LLP
We have served as the Company’s auditor since 2016.
Tampa, Florida
February 25, 2025
51
Report of Independent Registered Public Accounting Firm
Board of Directors and Shareholders
Helios Technologies, Inc.
Opinion on internal control over financial reporting
We have audited the internal control over financial reporting of Helios Technologies, Inc. (a Florida corporation) and subsidiaries (the “Company”) as of December 28, 2024, based on criteria established in the 2013 Internal Control—Integrated Framework issued by the Committee of Sponsoring Organizations of the Treadway Commission (“COSO”). In our opinion, the Company maintained, in all material respects, effective internal control over financial reporting as of December 28, 2024, based on criteria established in the 2013 Internal Control—Integrated Framework issued by COSO.
We also have audited, in accordance with the standards of the Public Company Accounting Oversight Board (United States) (“PCAOB”), the consolidated financial statements of the Company as of and for the year ended December 28, 2024, and our report dated February 25, 2025 expressed unqualified opinion on those financial statements.
Basis for opinion
The Company’s management is responsible for maintaining effective internal control over financial reporting and for its assessment of the effectiveness of internal control over financial reporting, included in the accompanying Management’s Report on Internal Control over Financial Reporting. Our responsibility is to express an opinion on the Company’s internal control over financial reporting based on our audit. We are a public accounting firm registered with the PCAOB and are required to be independent with respect to the Company in accordance with the U.S. federal securities laws and the applicable rules and regulations of the Securities and Exchange Commission and the PCAOB.
We conducted our audit in accordance with the standards of the PCAOB. Those standards require that we plan and perform the audit to obtain reasonable assurance about whether effective internal control over financial reporting was maintained in all material respects. Our audit included obtaining an understanding of internal control over financial reporting, assessing the risk that a material weakness exists, testing and evaluating the design and operating effectiveness of internal control based on the assessed risk, and performing such other procedures as we considered necessary in the circumstances. We believe that our audit provides a reasonable basis for our opinion.
Definition and limitations of internal control over financial reporting
A company’s internal control over financial reporting is a process designed to provide reasonable assurance regarding the reliability of financial reporting and the preparation of financial statements for external purposes in accordance with generally accepted accounting principles. A company’s internal control over financial reporting includes those policies and procedures that (1) pertain to the maintenance of records that, in reasonable detail, accurately and fairly reflect the transactions and dispositions of the assets of the company; (2) provide reasonable assurance that transactions are recorded as necessary to permit preparation of financial statements in accordance with generally accepted accounting principles, and that receipts and expenditures of the company are being made only in accordance with authorizations of management and directors of the company; and (3) provide reasonable assurance regarding prevention or timely detection of unauthorized acquisition, use, or disposition of the company’s assets that could have a material effect on the financial statements.
Because of its inherent limitations, internal control over financial reporting may not prevent or detect misstatements. Also, projections of any evaluation of effectiveness to future periods are subject to the risk that controls may become inadequate because of changes in conditions, or that the degree of compliance with the policies or procedures may deteriorate.
/s/
February 25, 2025
52
Helios Technologies, Inc.
Consolidated Balance Sheets
(in millions, except per share data)
|
|
December 28, 2024 |
|
|
December 30, 2023 |
|
||
Assets |
|
|
|
|
|
|
||
Current assets: |
|
|
|
|
|
|
||
Cash and cash equivalents |
|
$ |
|
|
$ |
|
||
Accounts receivable, net of allowance for credit losses of |
|
|
|
|
|
|
||
Inventories, net |
|
|
|
|
|
|
||
Income taxes receivable |
|
|
|
|
|
|
||
Other current assets |
|
|
|
|
|
|
||
Total current assets |
|
|
|
|
|
|
||
Property, plant and equipment, net |
|
|
|
|
|
|
||
Deferred income taxes |
|
|
|
|
|
|
||
Goodwill |
|
|
|
|
|
|
||
Other intangible assets, net |
|
|
|
|
|
|
||
Other assets |
|
|
|
|
|
|
||
Total assets |
|
$ |
|
|
$ |
|
||
Liabilities and shareholders' equity |
|
|
|
|
|
|
||
Current liabilities: |
|
|
|
|
|
|
||
Accounts payable |
|
$ |
|
|
$ |
|
||
Accrued compensation and benefits |
|
|
|
|
|
|
||
Other accrued expenses and current liabilities |
|
|
|
|
|
|
||
Current portion of long-term non-revolving debt, net |
|
|
|
|
|
|
||
Dividends payable |
|
|
|
|
|
|
||
Income taxes payable |
|
|
|
|
|
|
||
Total current liabilities |
|
|
|
|
|
|
||
Revolving lines of credit |
|
|
|
|
|
|
||
Long-term non-revolving debt, net |
|
|
|
|
|
|
||
Deferred income taxes |
|
|
|
|
|
|
||
Other noncurrent liabilities |
|
|
|
|
|
|
||
Total liabilities |
|
|
|
|
|
|
||
(Note 18) |
|
|
|
|
|
|
||
Shareholders' equity: |
|
|
|
|
|
|
||
Preferred stock, par value $ |
|
|
|
|
|
|
||
Common stock, par value $ |
|
|
|
|
|
|
||
Capital in excess of par value |
|
|
|
|
|
|
||
Retained earnings |
|
|
|
|
|
|
||
Accumulated other comprehensive loss |
|
|
( |
) |
|
|
( |
) |
Total shareholders' equity |
|
|
|
|
|
|
||
Total liabilities and shareholders' equity |
|
$ |
|
|
$ |
|
||
The accompanying Notes to the Consolidated Financial Statements are an integral part of these financial statements.
53
Helios Technologies, Inc.
Consolidated Statements of Operations
(in millions, except per share data)
|
|
For the year ended |
|
|||||||||
|
|
December 28, 2024 |
|
|
December 30, 2023 |
|
|
December 31, 2022 |
|
|||
Net sales |
|
$ |
|
|
$ |
|
|
$ |
|
|||
Cost of sales |
|
|
|
|
|
|
|
|
|
|||
Gross profit |
|
|
|
|
|
|
|
|
|
|||
Selling, engineering and administrative expenses |
|
|
|
|
|
|
|
|
|
|||
Amortization of intangible assets |
|
|
|
|
|
|
|
|
|
|||
Operating income |
|
|
|
|
|
|
|
|
|
|||
Interest expense, net |
|
|
|
|
|
|
|
|
|
|||
Foreign currency transaction loss (gain), net |
|
|
|
|
|
|
|
|
( |
) |
||
Other non-operating (income) expense, net |
|
|
( |
) |
|
|
( |
) |
|
|
( |
) |
Income before income taxes |
|
|
|
|
|
|
|
|
|
|||
Income tax provision |
|
|
|
|
|
|
|
|
|
|||
Net income |
|
$ |
|
|
$ |
|
|
$ |
|
|||
|
|
|
|
|
|
|
|
|
|
|||
Net income per share: |
|
|
|
|
|
|
|
|
|
|||
Basic |
|
$ |
|
|
$ |
|
|
$ |
|
|||
Diluted |
|
$ |
|
|
$ |
|
|
$ |
|
|||
|
|
|
|
|
|
|
|
|
|
|||
Weighted average shares outstanding: |
|
|
|
|
|
|
|
|
|
|||
Basic |
|
|
|
|
|
|
|
|
|
|||
Diluted |
|
|
|
|
|
|
|
|
|
|||
|
|
|
|
|
|
|
|
|
|
|||
Dividends declared per share |
|
$ |
|
|
$ |
|
|
$ |
|
|||
The accompanying Notes to the Consolidated Financial Statements are an integral part of these financial statements.
54
Helios Technologies, Inc.
Consolidated Statements of Comprehensive Income
(in millions)
|
|
For the year ended |
|
|||||||||
|
|
December 28, 2024 |
|
|
December 30, 2023 |
|
|
December 31, 2022 |
|
|||
Net income |
|
$ |
|
|
$ |
|
|
$ |
|
|||
Other comprehensive (loss) income |
|
|
|
|
|
|
|
|
|
|||
Foreign currency translation adjustments, net of tax |
|
|
( |
) |
|
|
|
|
|
( |
) |
|
Unrealized gain (loss) on interest rate swaps, net of tax |
|
|
|
|
|
( |
) |
|
|
|
||
Total other comprehensive (loss) income |
|
|
( |
) |
|
|
|
|
|
( |
) |
|
Comprehensive income |
|
$ |
|
|
$ |
|
|
$ |
|
|||
The accompanying Notes to the Consolidated Financial Statements are an integral part of these financial statements.
55
Helios Technologies, Inc.
(in millions)
|
|
|
|
|
|
|
|
|
|
|
|
|
|
|
|
|
|
|
|
Accumulated |
|
|
|
|
||||||||
|
|
|
|
|
|
|
|
|
|
|
|
|
|
Capital in |
|
|
|
|
|
other |
|
|
|
|
||||||||
|
|
Preferred |
|
|
Preferred |
|
|
Common |
|
|
Common |
|
|
excess of |
|
|
Retained |
|
|
comprehensive |
|
|
|
|
||||||||
|
|
shares |
|
|
stock |
|
|
shares |
|
|
stock |
|
|
par value |
|
|
earnings |
|
|
loss |
|
|
Total |
|
||||||||
Balance at January 1, 2022 |
|
|
|
|
$ |
|
|
|
|
|
$ |
|
|
$ |
|
|
$ |
|
|
$ |
( |
) |
|
$ |
|
|||||||
Shares issued, restricted stock |
|
|
|
|
|
|
|
|
|
|
|
— |
|
|
|
|
|
|
|
|
|
|
|
|
|
|||||||
Shares issued, ESPP |
|
|
|
|
|
|
|
|
|
|
|
|
|
|
|
|
|
|
|
|
|
|
|
|
||||||||
Shares issued, acquisitions |
|
|
|
|
|
|
|
|
|
|
|
|
|
|
|
|
|
|
|
|
|
|
|
|
||||||||
Stock-based compensation |
|
|
|
|
|
|
|
|
|
|
|
|
|
|
|
|
|
|
|
|
|
|
|
|
||||||||
Cancellation of shares for payment of employee tax withholding |
|
|
|
|
|
|
|
|
|
|
|
|
|
|
( |
) |
|
|
|
|
|
|
|
|
( |
) |
||||||
Dividends declared |
|
|
|
|
|
|
|
|
|
|
|
|
|
|
|
|
|
( |
) |
|
|
|
|
|
( |
) |
||||||
Net income |
|
|
|
|
|
|
|
|
|
|
|
|
|
|
|
|
|
|
|
|
|
|
|
|
||||||||
Other comprehensive loss |
|
|
|
|
|
|
|
|
|
|
|
|
|
|
|
|
|
|
|
|
( |
) |
|
|
( |
) |
||||||
Balance at December 31, 2022 |
|
|
|
|
$ |
|
|
|
|
|
$ |
|
|
$ |
|
|
$ |
|
|
$ |
( |
) |
|
$ |
|
|||||||
Shares issued, restricted stock |
|
|
|
|
|
|
|
|
|
|
|
— |
|
|
|
|
|
|
|
|
|
|
|
|
|
|||||||
Shares issued, ESPP |
|
|
|
|
|
|
|
|
|
|
|
|
|
|
|
|
|
|
|
|
|
|
|
|
||||||||
Shares issued, acquisitions |
|
|
|
|
|
|
|
|
|
|
|
|
|
|
|
|
|
|
|
|
|
|
|
|
||||||||
Stock-based compensation |
|
|
|
|
|
|
|
|
|
|
|
|
|
|
|
|
|
|
|
|
|
|
|
|
||||||||
Cancellation of shares for payment of employee tax withholding |
|
|
|
|
|
|
|
|
|
|
|
|
|
|
( |
) |
|
|
|
|
|
|
|
|
( |
) |
||||||
Dividends declared |
|
|
|
|
|
|
|
|
|
|
|
|
|
|
|
|
|
( |
) |
|
|
|
|
|
( |
) |
||||||
Net income |
|
|
|
|
|
|
|
|
|
|
|
|
|
|
|
|
|
|
|
|
|
|
|
|
||||||||
Other comprehensive income |
|
|
|
|
|
|
|
|
|
|
|
|
|
|
|
|
|
|
|
|
|
|
|
|
||||||||
Balance at December 30, 2023 |
|
|
|
|
$ |
|
|
|
|
|
$ |
|
|
$ |
|
|
$ |
|
|
$ |
( |
) |
|
$ |
|
|||||||
Shares issued, restricted stock |
|
|
|
|
|
|
|
|
|
|
|
— |
|
|
|
|
|
|
|
|
|
|
|
|
|
|||||||
Shares issued, ESPP |
|
|
|
|
|
|
|
|
|
|
|
|
|
|
|
|
|
|
|
|
|
|
|
|
||||||||
Stock-based compensation |
|
|
|
|
|
|
|
|
|
|
|
|
|
|
|
|
|
|
|
|
|
|
|
|
||||||||
Cancellation of shares for payment of employee tax withholding |
|
|
|
|
|
|
|
|
|
|
|
|
|
|
( |
) |
|
|
|
|
|
|
|
|
( |
) |
||||||
Dividends declared |
|
|
|
|
|
|
|
|
|
|
|
|
|
|
|
|
|
( |
) |
|
|
|
|
|
( |
) |
||||||
Net income |
|
|
|
|
|
|
|
|
|
|
|
|
|
|
|
|
|
|
|
|
|
|
|
|
||||||||
Other comprehensive loss |
|
|
|
|
|
|
|
|
|
|
|
|
|
|
|
|
|
|
|
|
( |
) |
|
|
( |
) |
||||||
Balance at December 28, 2024 |
|
|
|
|
$ |
|
|
|
|
|
$ |
|
|
$ |
|
|
$ |
|
|
$ |
( |
) |
|
$ |
|
|||||||
The accompanying Notes to the Consolidated Financial Statements are an integral part of these financial statements.
56
Helios Technologies, Inc.
Consolidated Statements of Cash Flows
(in millions)
|
|
For the year ended |
|
|||||||||
|
|
December 28, 2024 |
|
|
December 30, 2023 |
|
|
December 31, 2022 |
|
|||
Cash flows from operating activities: |
|
|
|
|
|
|
|
|
|
|||
Net income |
|
$ |
|
|
$ |
|
|
$ |
|
|||
Adjustments to reconcile net income to net cash provided by operating activities: |
|
|
|
|
|
|
|
|
|
|||
Depreciation and amortization |
|
|
|
|
|
|
|
|
|
|||
Stock-based compensation expense |
|
|
|
|
|
|
|
|
|
|||
Amortization of debt issuance costs |
|
|
|
|
|
|
|
|
|
|||
Benefit for deferred income taxes |
|
|
( |
) |
|
|
( |
) |
|
|
( |
) |
Forward contract losses (gains), net |
|
|
|
|
|
|
|
|
( |
) |
||
Other, net |
|
|
|
|
|
|
|
|
|
|||
(Increase) decrease in, net of acquisitions: |
|
|
|
|
|
|
|
|
|
|||
Accounts receivable |
|
|
|
|
|
|
|
|
|
|||
Inventories |
|
|
|
|
|
( |
) |
|
|
( |
) |
|
Income taxes receivable |
|
|
( |
) |
|
|
|
|
|
( |
) |
|
Other current assets |
|
|
( |
) |
|
|
( |
) |
|
|
|
|
Other assets |
|
|
|
|
|
( |
) |
|
|
|
||
Increase (decrease) in, net of acquisitions: |
|
|
|
|
|
|
|
|
|
|||
Accounts payable |
|
|
( |
) |
|
|
( |
) |
|
|
( |
) |
Accrued expenses and other liabilities |
|
|
|
|
|
( |
) |
|
|
( |
) |
|
Income taxes payable |
|
|
|
|
|
( |
) |
|
|
( |
) |
|
Other noncurrent liabilities |
|
|
( |
) |
|
|
|
|
|
( |
) |
|
Contingent consideration payments in excess of acquisition date fair value |
|
|
|
|
|
( |
) |
|
|
|
||
Net cash provided by operating activities |
|
|
|
|
|
|
|
|
|
|||
Cash flows from investing activities: |
|
|
|
|
|
|
|
|
|
|||
Business acquisitions, net of cash acquired |
|
|
|
|
|
( |
) |
|
|
( |
) |
|
Capital expenditures |
|
|
( |
) |
|
|
( |
) |
|
|
( |
) |
Proceeds from dispositions of property, plant and equipment |
|
|
|
|
|
|
|
|
|
|||
Cash settlement of forward contracts |
|
|
|
|
|
|
|
|
|
|||
Software development costs |
|
|
( |
) |
|
|
( |
) |
|
|
( |
) |
Net cash used in investing activities |
|
|
( |
) |
|
|
( |
) |
|
|
( |
) |
Cash flows from financing activities: |
|
|
|
|
|
|
|
|
|
|||
Borrowings on revolving credit facilities |
|
|
|
|
|
|
|
|
|
|||
Repayment of borrowings on revolving credit facilities |
|
|
( |
) |
|
|
( |
) |
|
|
( |
) |
Borrowings on long-term non-revolving debt |
|
|
|
|
|
|
|
|
|
|||
Repayment of borrowings on long-term non-revolving debt |
|
|
( |
) |
|
|
( |
) |
|
|
( |
) |
Proceeds from stock issued |
|
|
|
|
|
|
|
|
|
|||
Dividends to shareholders |
|
|
( |
) |
|
|
( |
) |
|
|
( |
) |
Payment of employee tax withholding on equity award vestings |
|
|
( |
) |
|
|
( |
) |
|
|
( |
) |
Payment of contingent consideration liability |
|
|
|
|
|
( |
) |
|
|
( |
) |
|
Proceeds received upon termination of Cash Flow hedge instruments |
|
|
|
|
|
|
|
|
|
|||
Other financing activities |
|
|
( |
) |
|
|
( |
) |
|
|
( |
) |
Net cash (used in) provided by financing activities |
|
|
( |
) |
|
|
|
|
|
( |
) |
|
Effect of exchange rate changes on cash and cash equivalents |
|
|
( |
) |
|
|
|
|
|
|
||
Net increase (decrease) in cash and cash equivalents |
|
|
|
|
|
( |
) |
|
|
|
||
Cash and cash equivalents, beginning of period |
|
|
|
|
|
|
|
|
|
|||
Cash and cash equivalents, end of period |
|
$ |
|
|
$ |
|
|
$ |
|
|||
57
|
|
For the year ended |
|
|||||||||
|
|
December 28, 2024 |
|
|
December 30, 2023 |
|
|
December 31, 2022 |
|
|||
Supplemental disclosure of cash flow information: |
|
|
|
|
|
|
|
|
|
|||
Cash paid: |
|
|
|
|
|
|
|
|
|
|||
Income taxes |
|
$ |
|
|
$ |
|
|
$ |
|
|||
Interest |
|
$ |
|
|
$ |
|
|
$ |
|
|||
Supplemental disclosure of noncash transactions: |
|
|
|
|
|
|
|
|
|
|||
Unrealized loss (gain) on interest rate swaps |
|
$ |
( |
) |
|
$ |
|
|
$ |
( |
) |
|
Stock issued for acquisition |
|
$ |
|
|
$ |
|
|
$ |
|
|||
Foreign currency remeasurement impact on euro denominated debt |
|
$ |
|
|
$ |
( |
) |
|
$ |
|
||
The accompanying Notes to the Consolidated Financial Statements are an integral part of these financial statements.
58
HELIOS TECHNOLOGIES, INC.
NOTES TO THE CONSOLIDATED FINANCIAL STATEMENTS
(Currencies in millions, except per share data)
1. COMPANY BACKGROUND
Helios Technologies, Inc. together with its wholly-owned subsidiaries, is a global leader in highly engineered motion control and electronic controls technology for diverse end markets, including construction, material handling, agriculture, energy, recreational vehicles, marine, health and wellness. Helios sells its products to customers in over
The Company operates in
2. SUMMARY OF SIGNIFICANT ACCOUNTING POLICIES
Basis of Presentation
The Company reports on a fiscal year that ends on the Saturday closest to December 31st. Each quarter generally consists of thirteen weeks, with a fourteen-week quarter occurring periodically. The 2024, 2023 and 2022 fiscal years contained 52 weeks and ended December 28, 2024, December 30, 2023, and December 31, 2022, respectively.
The Consolidated Financial Statements include the accounts and operations of Helios Technologies and its subsidiaries. All significant intercompany accounts and transactions are eliminated in consolidation.
Use of Estimates
The preparation of financial statements in conformity with accounting principles generally accepted in the United States of America requires management to make estimates and assumptions that affect the reported amounts of assets and liabilities and disclosure of contingent assets and liabilities at the date of the financial statements and the reported amounts of revenues and expenses during the reporting period. Actual results could differ from those estimates.
Certain conditions may result in a loss, which will only be resolved by future events. We, along with our legal counsel, evaluate such contingent liabilities, which inherently involves judgment. If it is probable that a loss has been incurred and can be reasonably estimated, we accrue for such contingent losses. If a potentially material loss contingency is not probable but reasonably possible, or is probable but cannot be estimated, we disclose the nature of the contingent liability and an estimate of the range of possible loss if determinable and material.
The Company records a contingent gain when the following conditions are met: (a) the amount to be received is known, (b) there is no potential for appeal or reversal, and (c) collectability is reasonably assured.
59
Foreign Currency Translation and Transactions
The financial statements of foreign subsidiaries are translated into U.S. dollars using period-end exchange rates for assets and liabilities and average exchange rates for operating results. Unrealized translation gains and losses are included in accumulated other comprehensive income (loss) (“AOCI”) in shareholders’ equity. When a transaction is denominated in a currency other than the subsidiary’s functional currency, the Company recognizes a transaction gain or loss in foreign currency transaction (gain) loss, net.
Business Combinations
Business combinations are accounted for under the acquisition method of accounting, which requires recognition separately from goodwill, the assets acquired and the liabilities assumed at their acquisition date fair values. While best estimates and assumptions are used to accurately value assets acquired and liabilities assumed at the acquisition date as well as contingent consideration, when applicable, the estimates are inherently uncertain and subject to refinement. As a result, during the measurement period, which may be up to one year from the acquisition date, adjustments that are based on new information obtained about facts and circumstances that existed as of the acquisition date are recorded to the assets acquired and liabilities assumed with the corresponding offset to goodwill. Upon the conclusion of the measurement period or final determination of the values of assets acquired or liabilities assumed, whichever comes first, any subsequent adjustments are recognized in the Consolidated Statements of Operations.
Fair Value Measurements
The Company applies fair value accounting guidelines for all financial assets and liabilities and non-financial assets and liabilities that are recognized or disclosed at fair value in the financial statements on a recurring basis (at least annually). Under these guidelines, fair value is defined as the price that would be received for the sale of an asset or paid to transfer a liability (i.e., an exit price) in an orderly transaction between market participants at the measurement date. The guidance establishes a three-tier fair value hierarchy that prioritizes the inputs used in measuring fair value as follows:
Level 1 - Quoted prices in active markets for identical assets or liabilities.
Level 2 - Observable inputs other than quoted prices included in Level 1, such as quoted prices for similar assets or liabilities in active markets or quoted prices for identical assets or liabilities in inactive markets.
Level 3 - Unobservable inputs that are supported by little, infrequent, or no market activity and reflect the Company’s own assumptions about inputs used in pricing the asset or liability.
The fair value hierarchy also requires an entity to maximize the use of observable inputs and minimize the use of unobservable inputs when measuring fair value.
The fair value of the Company’s cash and cash equivalents, accounts receivable, other current assets, accounts payable, accrued expenses and other liabilities approximate their carrying value, due to their short-term nature. Contingent consideration and newly acquired intangible assets are measured at fair value using level 3 inputs. The Company utilizes risk-adjusted probability analysis to estimate the fair value of contingent consideration arrangements. Forward foreign exchange contracts are measured at fair value based on quoted foreign exchange forward rates at the reporting dates. The fair value of interest rate swap contracts is based on the expected cash flows over the life of the trade. Expected cash flows are determined by evaluating transactions with a pricing model using a specific market environment. The values are estimated using the closing and mid-market market rate/price environment as of the end of the period. See Note 4 for detail on the level of inputs used in determining the fair value of assets and liabilities.
Cash and Cash Equivalents
The Company considers all highly liquid investments purchased with an original maturity of three months or less to be cash equivalents. Cash and cash equivalents are maintained at financial institutions and, at times, balances may exceed federally insured limits. The Company has never experienced any losses related to these balances. Any cash equivalents held by the Company are not significant. At year end 2024, of the $
60
Accounts Receivable, net
Accounts receivable are stated at amounts owed by customers, net of an allowance for estimated credit losses. The allowance for estimated credit losses is based on management’s assessment of amounts which may become uncollectible in the future and is estimated from a review of historical experience and specific identification of those accounts that are significantly in arrears. Account balances are charged against the allowance when it is probable the receivable will not be recovered. See the Consolidated Balance Sheets for the allowance amounts.
Inventories, net
Inventories are valued at the lower of cost and net realizable value, on a first-in, first-out basis. On an ongoing basis, component parts found to be obsolete through design or process changes are disposed of and charged to material cost. The Company reviews on-hand balances of products and component parts against specific criteria. Products and component parts without usage or that have excess quantities on hand are evaluated. An inventory reserve is then established for the appropriate inventory value of those products and component parts deemed to be obsolete or slow moving. See Note 5 for inventory reserve amounts.
Property, Plant and Equipment, net
Property, plant and equipment is stated at cost less accumulated depreciation. Expenditures for repairs and improvements that significantly add to the productive capacity or extend the useful life of an asset are capitalized. Repairs and maintenance are expensed as incurred. Depreciation is computed using the straight-line method generally over the following useful lives:
|
|
Years |
Machinery and equipment |
|
|
Office furniture and equipment |
|
|
Buildings |
|
|
Building and land improvements |
|
|
Leasehold improvements |
|
Gains or losses on the retirement, sale, or disposal of property, plant and equipment are reflected in the Consolidated Statement of Operations in the period in which the assets are taken out of service.
Leases
The Company determines whether an arrangement is a lease at its inception. Operating lease right-of-use (“ROU”) assets represent the Company’s right to use an underlying asset for the lease term and are presented in Property, plant and equipment in the Consolidated Balance Sheets. Operating lease liabilities represent the Company’s obligation to make lease payments arising from the leases and are presented in Other accrued expenses and current liabilities and Other noncurrent liabilities in the Consolidated Balance Sheets. ROU assets and lease liabilities are recognized at the lease commencement date based on the estimated present value of lease payments over the lease term.
The Company utilizes an estimated incremental borrowing rate, which is derived from information available at the lease commencement date, in determining the present value of lease payments. The Company considers its existing credit facilities when calculating the incremental borrowing rate.
Lease terms include options to extend the lease when it is reasonably certain that the Company will exercise the option. Leases with an initial term of 12 months or less are not recorded on the balance sheet. See Note 7 for additional disclosures related to leases.
61
Goodwill and Other Intangible Assets
Goodwill represents the excess of the purchase price of an acquisition over the fair value of the net assets acquired. We test goodwill for impairment at the reporting unit level, as of the third quarter period end date, on an annual basis and between annual tests whenever events or circumstances indicate the carrying value of a reporting unit may exceed its fair value. Examples of such circumstances could include, but are not limited to, a significant loss of market share, significant decline in operating results, change in management strategy or operations, economic decline, and other such significant disruptions to the business. As part of the impairment test, the Company has the option to first assess qualitative factors to determine whether the existence of events or circumstances leads to a determination that it is more likely than not that the fair value of a reporting unit is less than its carrying amount. If after this optional qualitative assessment, the Company determines that impairment is more likely than not, then the Company performs the quantitative impairment test. The carrying value of assets is calculated at the reporting unit level. An impairment loss is recorded to the extent that the fair value of the goodwill within the reporting unit is less than its carrying value, not exceeding the carrying amount of goodwill. Adjustments to the fair value of purchased assets and liabilities after the initial measurement period are recognized in net earnings. We generally use a combination of market and income approach methodologies to estimate the fair value of our reporting units.
Intangible assets consist primarily of customer relationships, technology, trade names and brands and supply agreements. Amortization is on a straight-line basis over their estimated useful lives and the amortization is reflected in the Consolidated Statements of Operations. The useful lives used are as follows: Customer Relationships -
Impairment of Long-Lived Assets
Long-lived assets, such as property and equipment, and purchased intangibles subject to amortization, are reviewed for impairment whenever events or changes in circumstances indicate that the carrying amount of an asset may not be recoverable. Recoverability of the asset is measured by comparison of its carrying amount to future net cash flows the asset is expected to generate. If such assets are considered impaired, the impairment to be recognized is measured as the amount by which the carrying amount of the asset exceeds its fair value. For the years ended December 28, 2024, December 30, 2023, and December 31, 2022, there were no impairments recorded.
Revenue Recognition
Revenue recognition is evaluated through the following five steps: 1) identification of the contracts with customers; 2) identification of the performance obligations in the contracts; 3) determination of the transaction price; 4) allocation of the transaction price to the performance obligations in the contract; and 5) recognition of revenue as or when performance obligations are satisfied.
The Company disaggregates revenue by reporting segment as well as by geographic destination of the sale. See disaggregated revenue balances in Note 16, Segment Reporting.
62
Revenue from Product Sales
The significant majority of the Company’s contracts with its customers are for standard product sales under standard ship and bill arrangements. The contracts are generally accounted for as having a single performance obligation for the manufacture of product, which is considered the only distinct promise in the contract, and are short term in nature, typically completed within and not exceeding
Revenue is recognized in an amount that reflects the consideration the Company expects to be entitled to in exchange for the goods. Consideration for product sales is primarily fixed in nature. The Company’s estimates for sales discounts, rebates and product returns reduce revenue recognized at the time of the sale.
Contract Assets & Liabilities
Contract assets are recognized when the Company has a conditional right to consideration for performance completed on contracts. Contract asset balances totaled $
Contract liabilities are recognized when payment is received from customers prior to satisfying the underlying performance obligation. Contract liabilities totaled $
Other Revenue Recognition Considerations
Contracts do not have significant financing components and payment terms do not exceed
The Company applies the practical expedient as permitted by the Financial Accounting Standards Board, which allows the omission of certain disclosures related to remaining performance obligations, as contract duration does not exceed one year.
The Company’s warranties provide assurance that products will function as intended. Estimated costs of product warranties are recognized at the time of the sale. The estimates are based upon current and historical warranty trends and other related information known to the Company.
63
A collaborative arrangement is a contractual arrangement that involves a joint operating activity involving two or more parties that meet both of the following requirements: they are active participants in the activity and they are exposed to significant risks and rewards dependent on the commercial success of the activity. The assessment for a collaborative arrangement is performed throughout the arrangement. In May 2024, the Company entered into a collaborative agreement with WaterGuru, Inc. (“Waterguru”) to design and produce water sensing and treatment products for the spa industry. Where Helios is the principal on sales transactions to third parties, it recognizes revenues, cost of sales and operating expenses on a gross basis on its statements of operations. Helios will pay Waterguru a portion of gross margin on the product specific transactions defined in the agreement for the term of the agreement. Where Helios is not the principal on sales transactions with other third parties, it records its share of the revenues, cost of sales and operating expenses on a net basis on its statements of operations. Waterguru will pay Helios a portion of revenues on the product specific transactions defined in the agreement for the term of the agreement. Revenues and costs associated with this arrangement in 2024 were not material.
Derivative Instruments and Hedging Activities
All derivative instruments are recorded gross on the Consolidated Balance Sheets at their respective fair values. The accounting for changes in the fair value of a derivative instrument depends on the intended use of the derivative, whether the Company has elected to designate a derivative in a hedging relationship and apply hedge accounting and whether the hedging relationship has satisfied the criteria necessary to apply hedge accounting. Derivatives designated and qualifying as a hedge of the exposure to variability in expected future cash flows, or other types of forecasted transactions, are considered cash flow hedges. For derivative instruments that are designated and qualify as a cash flow hedge, the effective portion of the gain or loss on the derivative instrument is initially reported as a component of AOCI and is subsequently reclassified into the line item within the Consolidated Statements of Operations in which the hedged items are recorded in the same period in which the hedged item affects earnings.
The Company enters into foreign exchange currency contracts that are not designated as hedging instruments for accounting purposes. Changes in the fair value of foreign exchange currency contracts not designated as hedging instruments are recognized in earnings. Derivative financial instruments are utilized as risk management tools and are not used for trading or speculative purposes.
The Company utilizes foreign currency denominated debt to hedge currency exposure in foreign operations. The Company designates certain foreign currency denominated debt as hedges of net investments in foreign operations, which reduces the Company’s exposure to changes in currency exchange rates on investments in non-U.S. subsidiaries. Gains and losses on net investments in non-U.S. operations are economically offset by losses and gains on foreign currency borrowings. The change in the U.S. dollar value of foreign currency denominated debt is recorded in Foreign currency translation adjustments, a component of AOCI.
Research and Development
The Company conducts R&D to create new products and to make improvements to products currently in use. R&D costs are charged to expense as incurred and totaled $
Stock-Based Compensation
All share-based compensation cost is measured at the grant date, based on the fair value of the award, and is recognized as an expense in earnings over the requisite service period. For performance-based share awards, the Company recognizes expense when it is determined the performance criteria are probable of being met. The probability of vesting is reassessed at each reporting date and compensation cost is adjusted using a cumulative catch up adjustment. Forfeitures are recognized in compensation cost when they occur. Benefits or deficiencies of tax deductions in excess of recognized compensation costs are reported within operating cash flows.
64
Income Taxes
The Company’s income tax policy provides for a balance sheet approach under which deferred income taxes are provided for based upon enacted tax laws and rates applicable to the periods in which the taxes become payable. These differences result from items reported differently for financial reporting and income tax purposes, primarily depreciation, accrued expenses and reserves. If necessary, the measurement of deferred tax assets is reduced by the amount of any tax benefits that are not expected to be realized based on available evidence.
The Company reports a liability for unrecognized tax benefits resulting from uncertain tax positions taken or expected to be taken in a tax return. The Company recognizes the effect of income tax positions only if those positions are more likely than not of being sustained. Recognized income tax positions are measured at the largest amount that is greater than
The Company accounts for Global Intangible Low-Taxed Income as a current-period expense when incurred.
The deferral method of accounting is used for investments that generate investment tax credits. Under this method, the investment tax credits are recognized as a reduction of the related asset.
Capitalized Software Development Costs
The Company sells certain products that contain embedded software that is integral to the functionality of the products. Internal and external costs incurred for developing this software are charged to expense until technological feasibility has been established, at which point the development costs are capitalized. Capitalized software development costs primarily include payroll, benefits and other headcount related expenses. Once the products are available for general release to customers, no additional costs are capitalized. Capitalized software development costs, net of accumulated amortization, were $
Earnings Per Share
The following table presents the computation of basic and diluted earnings per common share (in millions except per share data):
|
|
December 28, 2024 |
|
|
December 30, 2023 |
|
|
December 31, 2022 |
|
|||
Net income |
|
$ |
|
|
$ |
|
|
$ |
|
|||
|
|
|
|
|
|
|
|
|
|
|||
Weighted average shares outstanding - Basic |
|
|
|
|
|
|
|
|
|
|||
Net effect of dilutive securities - Stock based compensation |
|
|
|
|
|
|
|
|
|
|||
Weighted average shares outstanding - Diluted |
|
|
|
|
|
|
|
|
|
|||
|
|
|
|
|
|
|
|
|
|
|||
Net income per share: |
|
|
|
|
|
|
|
|
|
|||
Basic |
|
$ |
|
|
$ |
|
|
$ |
|
|||
Diluted |
|
$ |
|
|
$ |
|
|
$ |
|
|||
Recently Adopted Accounting Standards
65
In March 2020, and clarified through December 2022, the FASB issued ASU 2020-04, Reference Rate Reform (Topic 848): Facilitation of the Effects of Reference Rate Reform on Financial Reporting. This update provides optional expedients and exceptions for applying U.S. GAAP to contracts, hedging relationships and other transactions affected by reference rate reform. The guidance was effective immediately upon issuance in March 2020 and cannot be applied subsequent to December 31, 2024, except for certain optional expedients. The Company adopted the standard for the fiscal year beginning January 1, 2023. In March 2023, the Company executed an amendment to the term loan and revolving credit facility to modify and replace reference to the London Interbank Offered Rate ("LIBOR"). Additionally in March 2023, the Company executed an amendment to the interest rate swap agreements to modify and replace reference to LIBOR. The Company applied the accounting relief in accordance with ASC 848 as the relevant contract and hedge accounting relationship modifications were executed. The adoption of this standard did not have a material impact on our accounting policies or consolidated financial statements.
Beginning in 2024 annual reporting, we adopted Accounting Standards Update (ASU) No. 2023-07, Segment Reporting (Topic 280): Improvements to Reportable Segment Disclosures (ASU 2023-07) that was issued by the Financial Accounting Standards Board (FASB). This new standard requires an enhanced disclosure of significant segment expenses on an annual and interim basis. Upon adoption, the guidance was applied retrospectively to all prior periods presented in the financial statements, which resulted in the disclosure of selling, engineering and administrative expenses, research and development costs, indirect expenses, and amortization of intangible assets for each reportable segment. For additional information, see Note 16 — Segment Reporting.
Recently Issued Accounting Standards
The Financial Accounting Standards Board (FASB) issued Accounting Standards Update 2023-09 Income Taxes (Topic 740) - Improvements to Income Tax Disclosures. The amendments in this update focus on improving the transparency, effectiveness and comparability of income tax disclosures primarily related to the pretax income (or loss), income tax expense (or benefit), rate reconciliation and income taxes paid for public business entities. The amendments in this update are effective for annual periods beginning after December 15, 2024. Early adoption is permitted for annual financial statements that have not yet been issued or made available for issuance. The amendments in this update should be applied on a prospective basis. Retrospective application is permitted. The Company does not expect the additional income tax disclosures to have a material impact on the consolidated financial statements and does not plan to early adopt the standard.
In November 2024, the Financial Accounting Standards Board (FASB) issued Accounting Standard Update (ASU) No. 2024-03, Income Statement—Reporting Comprehensive Income—Expense Disaggregation Disclosures (Subtopic 220-40). This ASU requires enhanced disclosures about types of expenses, including purchases of inventory, employee compensation, depreciation, and amortization, in commonly presented expense captions. The amendments are effective for fiscal years beginning after December 15, 2026, and interim periods beginning after December 15, 2027, with early adoption permitted. Entities may apply the amendments prospectively or retrospectively to any or all prior periods presented in the financial statements. We are currently evaluating the impact that this guidance will have on the disclosures within our consolidated financial statements. While this ASU will impact only our disclosures and not our financial condition and results of operations, we are assessing when we will adopt the ASU.
3. BUSINESS ACQUISITIONS
2023 Acquisitions
On
66
industries, Schultes brings the manufacturing quality, reliability and responsiveness critical to its customers’ success. The results of Schultes' operations are reported in the Company’s Hydraulics segment and have been included in the Consolidated Financial Statements since the date of acquisition.
Initial cash consideration paid at closing for Schultes, net of cash acquired, totaled $
On
Initial consideration paid at closing for i3, net of cash acquired, totaled $
In connection with these acquisitions, the Company recorded $
The purchase price was allocated to tangible and intangible assets acquired and liabilities assumed based on their estimated fair values. The fair value of identified intangible assets acquired was based on estimates and assumptions made by management at the time of the acquisitions.
Pro forma results of operations and the revenue and net income subsequent to the acquisition dates for the acquisitions completed during fiscal 2023 have not been presented because the effects of the acquisitions, individually and in the aggregate, were not material to the Company's financial results.
2022 Acquisition of Daman
On
Daman is a leading designer and manufacturer of standard and custom precision hydraulic manifolds and other fluid conveyance products for its customer base, predominantly in North America. The acquisition of Daman expands the Company's technologies and markets and provides an opportunity to produce integrated package offerings with multiple Helios brands. The results of Daman’s operations are reported in the Company’s Hydraulics segment and have been included in the Consolidated Financial Statements since the date of acquisition.
Cash consideration paid, net of cash acquired, totaled $
The Company recorded $
67
Certain disclosures have not been presented as the effect of the acquisition was not material to the Company's financial results.
Other Acquisitions
In July 2022, we completed the acquisition of the assets of Taimi R&D, Inc., a Canadian manufacturer of innovative hydraulic components that offer ball-less design swivel products, which improve hydraulic reliability of equipment, increase the service life of components and help protect the environment by reduced leakage. The results of Taimi’s operations are reported in the Company’s Hydraulics segment. The results of operations of the acquired business are included in the Company's Consolidated Financial Statements since the date of acquisition. Certain disclosures have not been presented as the effects of the acquisition were not material to the Company's financial results.
4. FAIR VALUE OF FINANCIAL INSTRUMENTS
The following tables provide information regarding the Company’s assets and liabilities measured at fair value on a recurring basis at December 28, 2024 and December 30, 2023.
|
|
December 28, 2024 |
|
|||||||||||||
|
|
|
|
|
|
|
|
Significant Other |
|
|
Significant |
|
||||
|
|
|
|
|
Quoted Market |
|
|
Observable |
|
|
Unobservable |
|
||||
|
|
Total |
|
|
Prices (Level 1) |
|
|
Inputs (Level 2) |
|
|
Inputs (Level 3) |
|
||||
Assets |
|
|
|
|
|
|
|
|
|
|
|
|
||||
Interest rate swap contracts |
|
$ |
|
|
$ |
|
|
$ |
|
|
$ |
|
||||
Total |
|
$ |
|
|
$ |
|
|
$ |
|
|
$ |
|
||||
Liabilities |
|
|
|
|
|
|
|
|
|
|
|
|
||||
Contingent consideration |
|
$ |
|
|
$ |
|
|
$ |
|
|
$ |
|
||||
Total |
|
$ |
|
|
$ |
|
|
$ |
|
|
$ |
|
||||
|
|
December 30, 2023 |
|
|||||||||||||
|
|
|
|
|
|
|
|
Significant Other |
|
|
Significant |
|
||||
|
|
|
|
|
Quoted Market |
|
|
Observable |
|
|
Unobservable |
|
||||
|
|
Total |
|
|
Prices (Level 1) |
|
|
Inputs (Level 2) |
|
|
Inputs (Level 3) |
|
||||
Assets |
|
|
|
|
|
|
|
|
|
|
|
|
||||
Interest rate swap contract |
|
$ |
|
|
$ |
|
|
$ |
|
|
$ |
|
||||
Total |
|
$ |
|
|
$ |
|
|
$ |
|
|
$ |
|
||||
Liabilities |
|
|
|
|
|
|
|
|
|
|
|
|
||||
Contingent consideration |
|
|
|
|
|
|
|
|
|
|
|
|
||||
Total |
|
$ |
|
|
$ |
|
|
$ |
|
|
$ |
|
||||
A summary of changes in the estimated fair value of contingent consideration at December 28, 2024 and December 30, 2023 is as follows:
Balance at December 31, 2022 |
|
$ |
|
|
Change in estimated fair value |
|
|
( |
) |
Payment on liability |
|
|
( |
) |
Accretion in value |
|
|
|
|
Balance at December 30, 2023 |
|
$ |
|
|
Payment on liability |
|
|
( |
) |
Accretion in value |
|
|
|
|
Balance at December 28, 2024 |
|
$ |
|
68
5. INVENTORIES, NET
At December 28, 2024 and December 30, 2023, inventory consisted of the following:
|
|
December 28, 2024 |
|
|
December 30, 2023 |
|
||
Raw materials |
|
$ |
|
|
$ |
|
||
Work in process |
|
|
|
|
|
|
||
Finished goods |
|
|
|
|
|
|
||
Provision for obsolete and slow moving inventory |
|
|
( |
) |
|
|
( |
) |
Total |
|
$ |
|
|
$ |
|
||
6
At December 28, 2024 and December 30, 2023, property, plant and equipment, net consisted of the following:
|
|
December 28, 2024 |
|
|
December 30, 2023 |
|
||
Machinery and equipment |
|
$ |
|
|
$ |
|
||
Office furniture and equipment |
|
|
|
|
|
|
||
Buildings |
|
|
|
|
|
|
||
Building and land improvements |
|
|
|
|
|
|
||
Leasehold improvements |
|
|
|
|
|
|
||
Land |
|
|
|
|
|
|
||
|
|
$ |
|
|
$ |
|
||
Less: Accumulated depreciation |
|
|
( |
) |
|
|
( |
) |
Construction in progress |
|
|
|
|
|
|
||
|
|
$ |
|
|
$ |
|
||
Operating lease ROU assets |
|
|
|
|
|
|
||
Total |
|
$ |
|
|
$ |
|
||
Depreciation expense for the years ended December 28, 2024, December 30, 2023 and December 31, 2022 totaled $
7. OPERATING LEASES
The Company leases machinery, equipment, vehicles, buildings and office space throughout its locations that are classified as operating leases. Remaining terms on these leases range from less than
Supplemental balance sheet information related to operating leases is as follows:
|
|
December 28, 2024 |
|
|
December 30, 2023 |
|
||
Right-of-use assets |
|
$ |
|
|
$ |
|
||
Lease liabilities: |
|
|
|
|
|
|
||
|
$ |
|
|
$ |
|
|||
|
|
|
|
|
|
|||
|
$ |
|
|
$ |
|
|||
|
|
|
|
|
|
|
||
Weighted average remaining lease term (in years): |
|
|
|
|
|
|
||
Weighted average discount rate: |
|
|
% |
|
|
|
||
69
Supplemental cash flow information related to leases is as follows:
|
|
For the Year Ended |
|
|||||
|
|
December 28, 2024 |
|
|
December 30, 2023 |
|
||
Cash paid for amounts included in the measurement of lease liabilities: |
|
|
|
|
|
|
||
Operating cash flows from operating leases |
|
$ |
|
|
$ |
|
||
Non-cash impact of new leases and lease modifications |
|
$ |
|
|
$ |
|
||
Maturities of lease liabilities are as follows:
2025 |
|
$ |
|
|
2026 |
|
|
|
|
2027 |
|
|
|
|
2028 |
|
|
|
|
2029 |
|
|
|
|
Thereafter |
|
|
|
|
Total lease payments |
|
|
|
|
Less: Imputed interest |
|
|
( |
) |
Total lease obligations |
|
|
|
|
Less: Current lease liabilities |
|
|
( |
) |
Non-current lease liabilities |
|
$ |
|
8. GOODWILL AND INTANGIBLE ASSETS
Goodwill
A summary of changes in goodwill by segment for the years ended December 28, 2024 and December 30, 2023 is as follows:
|
|
Hydraulics |
|
|
Electronics |
|
|
Total |
|
|||
Balance at December 31, 2022 |
|
$ |
|
|
$ |
|
|
$ |
|
|||
Acquisition of Schultes |
|
|
|
|
|
|
|
|
|
|||
Acquisition of i3 Product Development |
|
|
|
|
|
|
|
|
|
|||
Currency translation |
|
|
|
|
|
|
|
|
|
|||
Balance at December 30, 2023 |
|
$ |
|
|
$ |
|
|
$ |
|
|||
Currency translation |
|
|
( |
) |
|
|
( |
) |
|
|
( |
) |
Balance at December 28, 2024 |
|
$ |
|
|
$ |
|
|
$ |
|
|||
Accumulated Impairments (A) |
|
|
|
|
|
|
|
|
|
|||
(A)
Acquired Intangibles Assets
At December 28, 2024 and December 30, 2023, intangible assets consisted of the following:
|
|
December 28, 2024 |
|
|
December 30, 2023 |
|
||||||||||||||||||
|
|
Gross Carrying |
|
|
Accumulated |
|
|
Net Carrying |
|
|
Gross Carrying |
|
|
Accumulated |
|
|
Net Carrying |
|
||||||
Definite-lived intangibles: |
|
|
|
|
|
|
|
|
|
|
|
|
|
|
|
|
|
|
||||||
Trade names and brands |
|
$ |
|
|
$ |
( |
) |
|
$ |
|
|
$ |
|
|
$ |
( |
) |
|
$ |
|
||||
Non-compete agreements |
|
|
|
|
|
( |
) |
|
|
|
|
|
|
|
|
( |
) |
|
|
|
||||
Technology |
|
|
|
|
|
( |
) |
|
|
|
|
|
|
|
|
( |
) |
|
|
|
||||
Supply agreement |
|
|
|
|
|
( |
) |
|
|
|
|
|
|
|
|
( |
) |
|
|
|
||||
Customer relationships |
|
|
|
|
|
( |
) |
|
|
|
|
|
|
|
|
( |
) |
|
|
|
||||
Workforce |
|
|
|
|
|
( |
) |
|
|
|
|
|
|
|
|
( |
) |
|
|
|
||||
|
|
$ |
|
|
$ |
( |
) |
|
$ |
|
|
$ |
|
|
$ |
( |
) |
|
$ |
|
||||
70
Amortization expense on acquired intangibles assets for the 2024, 2023 and 2022 fiscal years was approximately $
Year: |
|
|
|
|
2025 |
|
$ |
|
|
2026 |
|
|
|
|
2027 |
|
|
|
|
2028 |
|
|
|
|
2029 |
|
|
|
|
Thereafter |
|
|
|
|
Total |
|
$ |
|
|
9. DERIVATIVE INSTRUMENTS & HEDGING ACTIVITIES
The Company addresses certain financial exposures through a controlled program of risk management that includes the use of derivative financial instruments. The Company had entered into foreign currency forward contracts to reduce the effects of fluctuating foreign currency exchange rates. In addition, the Company had entered into interest rate derivatives to manage the effects of interest rate movements on the Company’s credit facilities.
For each derivative contract entered into where the Company looks to obtain hedge accounting treatment, the Company formally and contemporaneously documents all relationships between hedging instruments and hedged items, as well as its risk-management objective and strategy for undertaking the hedge transaction, the nature of the risk being hedged, how the hedging instruments’ effectiveness in offsetting the hedged risk will be assessed prospectively and retrospectively. This process includes linking all derivatives to specific assets and liabilities on the balance sheet or to specific firm commitments or forecasted transactions. The Company also formally assesses, both at the inception of the hedges and on an ongoing basis, whether the derivatives that are used in hedging transactions are highly effective in offsetting changes in fair values or cash flows of hedged items. If it is determined that a derivative is not highly effective, or that it has ceased to be a highly effective hedge, the Company will discontinue hedge accounting with respect to that derivative prospectively.
The fair value of the Company’s derivative financial instruments included in the Consolidated Balance Sheets is presented as follows:
|
Asset Derivatives |
|
|
Liability Derivatives |
|
||||||||||||||
|
Balance Sheet |
|
Fair Value (1) |
|
|
Fair Value (1) |
|
|
Balance Sheet |
|
Fair Value (1) |
|
|
Fair Value (1) |
|
||||
|
Location |
|
December 28, 2024 |
|
|
December 30, 2023 |
|
|
Location |
|
December 28, 2024 |
|
|
December 30, 2023 |
|
||||
Derivatives designated as hedging instruments: |
|
|
|
|
|
|
|
|
|
|
|
|
|||||||
Interest rate swap contracts |
|
$ |
|
|
$ |
|
|
|
$ |
|
|
$ |
|
||||||
|
|
|
|
|
|
|
|
|
|
|
|
|
|
|
|
||||
Derivatives not designated as hedging instruments: |
|
|
|
|
|
|
|
|
|
|
|
|
|||||||
Forward foreign exchange contracts |
|
|
|
|
|
|
|
|
|
|
|
|
|
||||||
Forward foreign exchange contracts |
Other assets |
|
|
|
|
|
|
|
Other non-current liabilities |
|
|
|
|
|
|
||||
Total derivatives |
|
|
$ |
|
|
$ |
|
|
|
|
$ |
|
|
$ |
|
||||
(1) See Note 4 for information regarding the inputs used in determining the fair value of derivative assets and liabilities. |
|
||||||||||||||||||
71
Gains and losses related to the Company’s derivative financial instruments for the 2024, 2023 and 2022 years are presented as follows:
|
|
Amount of Gain or (Loss) Recognized in Other Comprehensive Income on Derivative (Effective Portion) |
|
|
Location of Gain or (Loss) Reclassified from Accumulated Other Comprehensive Income |
|
Amount of Gain or (Loss) Reclassified from Accumulated Other Comprehensive Income into Earnings (Effective Portion) |
|
||||||||||||||
|
|
December 28, 2024 |
|
December 30, 2023 |
|
December 31, 2022 |
|
|
into Earnings (Effective Portion) |
|
December 28, 2024 |
|
December 30, 2023 |
|
December 31, 2022 |
|
||||||
Derivatives in cash flow hedging relationships: |
|
|
|
|
|
|
|
|
|
|
||||||||||||
Interest rate swap contracts |
|
$ |
|
$ |
( |
) |
$ |
|
|
Interest expense, net |
|
$ |
|
$ |
|
$ |
( |
) |
||||
Interest expense presented in the Consolidated Statements of Operations, in which the effects of cash flow hedges are recorded, totaled $
|
|
Amount of Gain or (Loss) Recognized |
|
|
Location of Gain or (Loss) Recognized |
|||||||
|
|
December 28, 2024 |
|
December 30, 2023 |
|
December 31, 2022 |
|
|
in Earnings on Derivatives |
|||
Derivatives not designated as hedging instruments: |
|
|
|
|||||||||
|
$ |
|
$ |
( |
) |
$ |
|
|
Foreign currency transaction gain / loss, net |
|||
Interest Rate Swap Contracts
The Company primarily utilizes variable-rate debt, which exposes the Company to variability in interest payments. The Company enters into various types of derivative instruments to manage fluctuations in cash flows resulting from interest rate risk attributable to changes in the benchmark interest rates.
The Company assesses interest rate cash flow risk by continually identifying and monitoring changes in interest rate exposures that may adversely impact expected future cash flows and by evaluating hedging opportunities.
The Company maintains risk management control systems to monitor interest rate cash flow risk attributable to both the Company’s outstanding and forecasted debt obligations as well as the Company’s offsetting hedge positions. The risk management control systems involve the use of analytical techniques to estimate the expected impact of changes in interest rates on the Company’s future cash flows.
Previously, the Company had entered into interest rate swap transactions to hedge the variable interest rate payments on its credit facilities. In connection with these transactions, the Company paid interest based upon a fixed rate as agreed upon with the respective counterparties and received variable rate interest payments. The interest rate swaps were designated as hedging instruments and were accounted for as cash flow hedges. In June 2024, the Company's interest rate swap agreements were terminated in connection with the debt refinancing activities. Upon termination of these effective interest rate swaps designated as a cash flow hedges, the Company received proceeds of $
Forward Foreign Exchange Contracts
The Company had entered into forward contracts to economically hedge translational and transactional exposure associated with various business units whose local currency differs from the Company’s reporting currency. The Company’s forward contracts are not designated as hedging instruments for accounting purposes.
At December 28, 2024, the Company had
72
Net Investment Hedge
The Company utilizes foreign currency denominated debt to hedge currency exposure in foreign operations. The Company has designated €
10. CREDIT FACILITIES
Total non-revolving debt consists of the following:
|
Maturity Date |
|
December 28, 2024 |
|
|
December 30, 2023 |
|
||
Long-term non-revolving debt: |
|
|
|
|
|
|
|
||
Term loans with PNC Bank |
|
$ |
|
|
$ |
|
|||
Term loans with Citibank |
|
|
|
|
|
|
|||
Total non-revolving debt |
|
|
|
|
|
|
|
||
Less: current portion of long-term non-revolving debt |
|
|
|
|
|
|
|||
Less: unamortized debt issuance costs |
|
|
|
|
|
|
|
||
Total long-term non-revolving debt, net |
|
|
$ |
|
|
$ |
|
||
Information on the Company's revolving credit facilities is as follows:
|
|
|
Balance |
|
|
Available credit |
|
||||||||||
|
Maturity Date |
|
December 28, 2024 |
|
|
December 30, 2023 |
|
|
December 28, 2024 |
|
|
December 30, 2023 |
|
||||
Revolving line of credit with PNC Bank |
|
$ |
|
|
$ |
|
|
$ |
|
|
$ |
|
|||||
Revolving line of credit with Citibank |
|
$ |
|
|
$ |
|
|
$ |
|
|
$ |
|
|||||
Future maturities of total debt are as follows:
Year: |
|
|
|
2025 |
$ |
|
|
2026 |
|
|
|
2027 |
|
|
|
2028 |
|
|
|
2029 |
|
|
|
Total |
$ |
|
|
Term Loans and Line of Credit with PNC Bank
The Company has a credit agreement that includes a revolving line of credit and term loan credit facility with PNC Bank, National Association, as administrative agent, and the lenders party thereto.
In May 2023, the Company entered into an Incremental Facility Amendment with PNC Bank, National Association, as administrative agent, and various lenders party thereto that amended the Second Amended and Restated Credit Agreement, dated October 28, 2020 (the “Credit Agreement” and, together with the Incremental Facility Amendment, the “Amended Credit Agreement”). Pursuant to the Incremental Facility Amendment, the Company incurred a new senior secured term loan A-2 (the “Term Loan A-2”) in an aggregate principal amount of $
73
Company’s domestic subsidiaries and is secured by substantially all of the assets of the Company and the guarantors, on a pari passu basis with the other facilities under the Amended Credit Agreement. The Term Loan A-2 was due to mature on
On June 25, 2024, the Company amended and restated its credit agreement (the “Third Amended and Restated Credit Agreement”) with PNC Bank, National Association, as administrative agent, and the lenders party thereto. The amendment extended the debt maturity for
The Third Amended and Restated Credit Agreement states that borrowings under the Revolving Credit Facility that are U.S. dollar denominated and the Term Loan Facility can accrue interest at a variable rate equal to (i) the term secured overnight financing rate (“Term SOFR”) or (ii) the greater of (a) the overnight bank funding rate, plus
The obligations under the Third Amended and Restated Credit Agreement are guaranteed by each of the Company’s domestic subsidiaries. The obligations under the Third Amended and Restated Credit Agreement are secured by substantially all of the assets of the Company and the guarantors.
Scheduled principal payments under the Term Loan Facility are payable in quarterly installments beginning on September 28, 2024 and continuing on the last day of each following fiscal quarter, beginning at $
The revolving line of credit allows for borrowings up to an aggregate maximum principal amount of $
The Third Amended and Restated Credit Agreement requires the Company to comply with a number of restrictive covenants, including limitations on the Company’s ability to incur indebtedness; create or maintain liens on its property or assets; make investments, loans and advances; repurchase shares of its common stock; engage in acquisitions, mergers, joint ventures, consolidation and asset sales; and pay dividends and distributions (listing not all inclusive). The Third Amended and Restated Credit Agreement requires the Company to maintain a consolidated total net leverage ratio not to exceed
As of December 28, 2024, the Company was in compliance with all debt covenants related to the Amended Credit Agreement.
74
Term Loans and Line of Credit with Citibank
The Company has an uncommitted fixed asset facility agreement (the “Fixed Asset Facility”), short-term revolving facility agreement (the “Working Capital Facility”) and term loan facility agreement (the “Shanghai Branch Term Loan Facility”) with Citibank (China) Co., Ltd. Shanghai Branch, as lender.
Under the Fixed Asset Facility, the Company borrowed on a secured basis RMB
Under the Working Capital Facility, the Company may from time to time borrow amounts on an unsecured revolving facility of up to a total of RMB
Under the Shanghai Branch Term Loan Facility, the Company borrowed on a secured basis RMB
The Company has a term loan facility agreement (the “Sydney Branch Term Loan Facility”) with Citibank, N.A., Sydney Branch, as lender. Under the Sydney Branch Term Loan Facility, the Company borrowed on a secured basis AUD
In June 2023, the Sydney Branch Term Loan Facility was amended. The Company borrowed on a secured basis AUD
Concurrent with the amendment to the Sydney Branch Term Loan Facility, the Company entered into a revolving line of credit agreement with Citibank, N.A., Sydney Branch, as lender (the “Sydney Branch RC Facility”). The Sydney Branch RC Facility allows for borrowings up to an aggregate maximum principal amount of AUD
As of the date of this filing, the Company was in compliance with all debt covenants related to the term loans and line of credit with Citibank. Additionally, the secured loans with Citibank are secured by a parent guarantee.
The consolidated effective interest rate on the Company's credit agreements at December 28, 2024 was
The Company declared dividends of $
75
The Company declared the following regular quarterly dividends to shareholders during 2024, 2023 and 2022. The dividends were declared to shareholders of record on the 5th day following the respective quarter end and paid on the 20th day of each month following the date of declaration.
|
|
2024 |
|
|
2023 |
|
|
2022 |
|
|||
First quarter |
|
$ |
|
|
$ |
|
|
$ |
|
|||
Second quarter |
|
|
|
|
|
|
|
|
|
|||
Third quarter |
|
|
|
|
|
|
|
|
|
|||
Fourth quarter |
|
|
|
|
|
|
|
|
|
|||
12. INCOME TAXES
For financial reporting purposes, income before income taxes includes the following components:
|
|
For the year ended |
|
|||||||||
|
|
December 28, 2024 |
|
|
December 30, 2023 |
|
|
December 31, 2022 |
|
|||
United States |
|
$ |
|
|
$ |
|
|
$ |
|
|||
Foreign |
|
|
|
|
|
|
|
|
|
|||
Total |
|
$ |
|
|
$ |
|
|
$ |
|
|||
The Company derives its pretax income based on the consolidated results of its legal entities. The U.S. legal entities had third-party export sales of $
The components of the income tax provision (benefit) are as follows:
|
|
For the year ended |
|
|||||||||
|
|
December 28, 2024 |
|
|
December 30, 2023 |
|
|
December 31, 2022 |
|
|||
Current tax expense (benefit): |
|
|
|
|
|
|
|
|
|
|||
United States |
|
$ |
|
|
$ |
|
|
$ |
|
|||
State and local |
|
|
|
|
|
|
|
|
|
|||
Foreign |
|
|
|
|
|
|
|
|
|
|||
Total current |
|
|
|
|
|
|
|
|
|
|||
Deferred tax expense (benefit): |
|
|
|
|
|
|
|
|
|
|||
United States |
|
|
( |
) |
|
|
( |
) |
|
|
( |
) |
State and local |
|
|
|
|
|
( |
) |
|
|
( |
) |
|
Foreign |
|
|
( |
) |
|
|
( |
) |
|
|
( |
) |
Total deferred |
|
|
( |
) |
|
|
( |
) |
|
|
( |
) |
Total income tax provision |
|
$ |
|
|
$ |
|
|
$ |
|
|||
76
The reconciliation between the effective income tax rate and the U.S. federal statutory rate is as follows:
|
|
For the year ended |
|
|||||||||
|
|
December 28, 2024 |
|
|
December 30, 2023 |
|
|
December 31, 2022 |
|
|||
U.S. federal taxes at statutory rate |
|
$ |
|
|
$ |
|
|
$ |
|
|||
Increase (decrease) |
|
|
|
|
|
|
|
|
|
|||
Foreign withholding tax |
|
|
|
|
|
|
|
|
|
|||
Capitalized transaction costs |
|
|
|
|
|
|
|
|
|
|||
Foreign income taxed at different rate |
|
|
|
|
|
|
|
|
|
|||
FDII deduction |
|
|
( |
) |
|
|
( |
) |
|
|
( |
) |
Changes in estimates related to prior years including foreign |
|
|
|
|
|
|
|
|
|
|||
State and local taxes, net |
|
|
|
|
|
( |
) |
|
|
( |
) |
|
Foreign tax expense |
|
|
|
|
|
|
|
|
|
|||
Current year tax credits |
|
|
( |
) |
|
|
( |
) |
|
|
( |
) |
Foreign deferred other true up and permanent items |
|
|
( |
) |
|
|
( |
) |
|
|
( |
) |
Change in reserve |
|
|
|
|
|
|
|
|
|
|||
Excess officer compensation |
|
|
( |
) |
|
|
|
|
|
|
||
Change in valuation allowance |
|
|
( |
) |
|
|
|
|
|
|
||
Stock-based compensation |
|
|
|
|
|
|
|
|
( |
) |
||
Other |
|
|
|
|
|
|
|
|
|
|||
Income tax provision |
|
$ |
|
|
$ |
|
|
$ |
|
|||
The effective tax rate for the year ended December 28, 2024 was lower than the rate for 2023 primarily due to the decrease in valuation allowance and impact of excess officer compensation. The rate for all years benefited from tax deductions for FDII deduction and R&D tax credits.
Deferred income tax assets and liabilities are provided to reflect the future tax consequences of differences between the tax basis of assets and liabilities and their reported amounts in the financial statements. The temporary differences that give rise to significant portions of the deferred tax assets and liabilities as of December 28, 2024 and December 30, 2023, are presented below:
|
|
December 28, 2024 |
|
|
December 30, 2023 |
|
||
Deferred tax assets: |
|
|
|
|
|
|
||
Foreign tax benefit of U.S. reserves |
|
$ |
|
|
$ |
|
||
Net operating losses |
|
|
|
|
|
|
||
Inventory |
|
|
|
|
|
|
||
Intangible assets and goodwill |
|
|
|
|
|
|
||
Lease liability |
|
|
|
|
|
|
||
Capitalized research expenditures |
|
|
|
|
|
|
||
Interest expense limitation carryforward |
|
|
|
|
|
|
||
Accrued expenses and other |
|
|
|
|
|
|
||
Other comprehensive income |
|
|
|
|
|
|
||
Total deferred tax assets |
|
|
|
|
|
|
||
Less: Valuation allowance |
|
|
( |
) |
|
|
( |
) |
Net deferred tax assets |
|
|
|
|
|
|
||
Deferred tax liabilities: |
|
|
|
|
|
|
||
Depreciation |
|
|
( |
) |
|
|
( |
) |
Right of use asset |
|
|
( |
) |
|
|
( |
) |
Intangible assets and goodwill |
|
|
( |
) |
|
|
( |
) |
Other deferred tax liabilities |
|
|
( |
) |
|
|
|
|
Total deferred tax liabilities |
|
|
( |
) |
|
|
( |
) |
Net deferred tax liabilities |
|
$ |
( |
) |
|
$ |
( |
) |
77
As of December 28, 2024, the Company has federal net operating loss (“NOL”) carryforwards of approximately $
A valuation allowance to reduce the deferred tax assets reported is required if, based on the weight of the evidence, it is more likely than not that some portion or all of the deferred tax assets will not be realized. The valuation allowance for deferred tax assets as of December 28, 2024 and December 30, 2023 was $
The Company accounts for investment tax credits utilizing the deferral method. Investment tax credits generated in 2024 totaled $
The Company prescribes a recognition threshold and measurement attribute for an uncertain tax position taken or expected to be taken in a tax return.
The following is a roll-forward of the Company’s unrecognized tax benefits:
Unrecognized tax benefits - January 1, 2022 |
|
$ |
|
|
Increases from positions taken during prior periods |
|
|
|
|
Increases from positions taken during current period |
|
|
|
|
Settled positions |
|
|
( |
) |
Lapse of statute of limitations |
|
|
( |
) |
Unrecognized tax benefits - December 31, 2022 |
|
$ |
|
|
Increases from positions taken during prior periods |
|
|
|
|
Increases from positions taken during current period |
|
|
|
|
Settled positions |
|
|
( |
) |
Lapse of statute of limitations |
|
|
( |
) |
Unrecognized tax benefits - December 30, 2023 |
|
$ |
|
|
Decreases from positions taken during prior periods |
|
|
( |
) |
Increases from positions taken during current period |
|
|
|
|
Settled positions |
|
|
|
|
Lapse of statute of limitations |
|
|
( |
) |
Unrecognized tax benefits - December 28, 2024 |
|
$ |
|
At December 28, 2024, the Company had unrecognized tax benefits of $
78
13. STOCK-BASED COMPENSATION
Equity Incentive Plan
The Company’s 2023 Equity Incentive Plan (“2023 Plan”) provides for the grant of up to an aggregate of
Restricted Stock Units
The Company grants restricted stock units (“RSUs”) to employees in connection with a long-term incentive plan and from time to time for special recognition. Awards with time-based vesting requirements primarily vest ratably over a
Effective January 1, 2022, The Board approved a new Helios Technologies, Inc. Non-Employee Director Compensation Policy (the “Director Compensation Policy”), which revised the compensation for Non-Employee Directors. The Director Compensation Policy compensates Non-Employee Directors for their board service with cash awards and equity-based compensation through grants of RSUs, issued pursuant to the 2019 Plan or 2023 Plan, which vest over a one-year period. Directors were granted
The following table summarizes RSU activity for the 2024 fiscal year:
|
|
Number of |
|
|
Weighted Average |
|
||
Nonvested balance at December 30, 2023 |
|
|
|
|
$ |
|
||
Granted |
|
|
|
|
|
|
||
Vested |
|
|
( |
) |
|
|
|
|
Forfeited |
|
|
( |
) |
|
|
|
|
Nonvested balance at December 28, 2024 |
|
|
|
|
$ |
|
||
Included in the nonvested balance at December 28, 2024, is
The grant date fair value of restricted stock and RSUs granted during the 2024, 2023 and 2022 fiscal years totaled $
The Company had $
79
Stock Options
In 2022, the Company granted stock options with market-based vesting conditions to its officers. As of December 28, 2024, there were
The Company has also granted stock options with only time-based vesting conditions to its officers. As of December 28, 2024, there were
In September 2024, the Company granted additional stock options with only time-based vesting conditions to its officers and employees. These options have an exercise price per share of $
At December 28, 2024, the Company had $
|
|
Number of |
|
|
Weighted Average |
|
||
Outstanding at December 30, 2023 |
|
|
|
|
$ |
|
||
Granted |
|
|
|
|
|
|
||
Exercised |
|
|
( |
) |
|
|
|
|
Forfeited/Expired |
|
|
( |
) |
|
|
|
|
Outstanding at December 28, 2024 |
|
|
|
|
|
|
||
Exercisable at December 28, 2024 (A) |
|
|
|
|
|
|
||
(A) Options expire between the years 2030-2032 with strike prices between $39.75 - $55.03.
Employee Stock Purchase Plans
The Company maintains an Employee Stock Purchase Plan (“ESPP”) in which U.S. employees are eligible to participate. Employees who choose to participate are granted an opportunity to purchase common stock at
Employees purchased
80
14. EMPLOYEE BENEFITS
The Company has a defined contribution retirement plan, under the provisions of Section 401(k) of the Internal Revenue Code, covering substantially all of its eligible U.S. employees. Employer contribution costs recognized under the retirement plan amounted to approximately $
The Company provides supplemental pension benefits to its employees of foreign operations in addition to mandatory benefits included in local country payroll statutes. These benefits amounted to approximately $
15. ACCUMULATED OTHER COMPREHENSIVE LOSS
The following table presents changes in accumulated other comprehensive loss by component:
|
|
Unrealized |
|
|
Foreign |
|
|
Total |
|
|||
Balance at January 1, 2022 |
|
$ |
( |
) |
|
$ |
( |
) |
|
|
( |
) |
Other comprehensive income (loss) before |
|
|
|
|
|
( |
) |
|
|
( |
) |
|
Amounts reclassified from accumulated |
|
|
( |
) |
|
|
|
|
|
( |
) |
|
Tax effect |
|
|
( |
) |
|
|
|
|
|
|
||
Net current period other comprehensive income (loss) |
|
|
|
|
|
( |
) |
|
|
( |
) |
|
Balance at December 31, 2022 |
|
$ |
|
|
$ |
( |
) |
|
$ |
( |
) |
|
Other comprehensive (loss) income before |
|
|
( |
) |
|
|
|
|
|
|
||
Amounts reclassified from accumulated |
|
|
|
|
|
|
|
|
|
|||
Tax effect |
|
|
|
|
|
( |
) |
|
|
( |
) |
|
Net current period other comprehensive (loss) income |
|
|
( |
) |
|
|
|
|
|
|
||
Balance at December 30, 2023 |
|
$ |
|
|
$ |
( |
) |
|
$ |
( |
) |
|
Other comprehensive income (loss) before |
|
|
( |
) |
|
|
( |
) |
|
|
( |
) |
Amounts reclassified from accumulated |
|
|
|
|
|
|
|
|
|
|||
Tax effect |
|
|
( |
) |
|
|
|
|
|
|
||
Net current period other comprehensive income (loss) |
|
|
|
|
|
( |
) |
|
|
( |
) |
|
Balance at December 28, 2024 |
|
$ |
|
|
$ |
( |
) |
|
$ |
( |
) |
|
The following table presents reclassifications out of accumulated other comprehensive loss:
Details about Accumulated Other |
Affected Line Item in the Consolidated |
For the year Ended |
|
|||||||||
Comprehensive Income Components |
Statements of Operations |
December 28, 2024 |
|
|
December 30, 2023 |
|
|
December 31, 2022 |
|
|||
Derivative financial instruments |
|
|
|
|
|
|
|
|
|
|||
Interest rate swaps |
Interest expense, net |
$ |
|
|
$ |
|
|
$ |
( |
) |
||
|
Tax benefit |
|
( |
) |
|
|
( |
) |
|
|
|
|
|
Net of tax |
$ |
|
|
$ |
|
|
$ |
( |
) |
||
|
|
|
|
|
|
|
|
|
|
|||
Total reclassifications for the period |
|
$ |
|
|
$ |
|
|
$ |
( |
) |
||
81
16. SEGMENT REPORTING
The Company has
The Hydraulics segment designs and manufactures hydraulic components and systems used to transmit power and control force, speed and motion. There are two categories based on Hydraulic system architecture: MCT and FCT. MCT includes components used to control the flow and pressure of fluids in a system including valves, pumps, actuators, sensors, and filters. FCT includes components used to convey fluids and fluid power through a system and are designed to grant maximum flexibility of design and reliability. MCT includes manifold and cartridge valve technology and FCT includes quick release coupling solutions. CVT products provide functions important to a hydraulic system: to control rates and direction of fluid flow and to regulate and control pressures. QRC products allow users to connect and disconnect quickly from any hydraulic circuit without leakage and ensures high-performance under high temperature and pressure using one or multiple couplers. Engineered solutions that incorporate CVT and QRC technologies are also provided to machine users, manufacturers or designers to fulfill complete system design requirements including electro-hydraulic, remote control, electronic control and programmable logic controller systems.
The Electronics segment provides complete, fully-tailored display and control solutions for engines, engine-driven equipment, specialty vehicles, therapy baths and traditional and swim spas. This broad range of products is complemented by extensive application expertise and unparalleled depth of software, embedded programming, hardware and sustaining engineering teams. Product categories include traditional mechanical and electronic gauge instrumentation, plug and go CAN-based instruments, robust environmentally sealed controllers, pumps and jets, hydraulic controllers, engineered panels, process monitoring instrumentation, proprietary hardware and software, printed circuit board assemblies and wiring harnesses. Support services include design and manufacturing and after-market support through global distribution.
The Company evaluates performance and allocates resources based primarily on segment operating income. Certain costs were not allocated to the business segments as they are not used in evaluating the results of, or in allocating resources to the Company’s segments. These costs are presented in the Corporate and other line item. For the year ended December 28, 2024, these unallocated costs totaled $
Net sales and operating profit of our business segments exclude intersegment sales, cost of sales and profit as these activities are eliminated in consolidation and thus are not included in management’s evaluation of performance of each segment.
Beginning in our 2024 annual reporting, we adopted ASU 2023-07 retrospectively.
82
|
|
At and for the Year Ended December 28, 2024 |
|
|||||||||||||
|
|
Hydraulics |
|
|
Electronics |
|
|
Unallocated expenses |
|
|
Total |
|
||||
Net sales from external customers |
|
$ |
|
|
$ |
|
|
$ |
|
|
$ |
|
||||
Reportable segment total cost of sales |
|
|
|
|
|
|
|
|
|
|
|
|
||||
Reportable segment gross profit |
|
$ |
|
|
$ |
|
|
$ |
|
|
$ |
|
||||
Selling, engineering and administrative expenses (a) |
|
$ |
|
|
$ |
|
|
$ |
|
|
$ |
|
||||
Research and development (b) |
|
|
|
|
|
|
|
|
|
|
|
|
||||
Indirect expenses (c) |
|
|
|
|
|
|
|
|
|
|
|
|
||||
Amortization of intangible assets (d) |
|
|
|
|
|
|
|
|
|
|
|
|
||||
Operating income |
|
$ |
|
|
$ |
|
|
$ |
( |
) |
|
$ |
|
|||
(a)
(b) Research and development primarily includes engineering-related costs to create new products and to make improvements to products currently in use
(c)
(d)
|
|
At and for the Year Ended December 30, 2023 |
|
|||||||||||||
|
|
Hydraulics |
|
|
Electronics |
|
|
Unallocated expenses |
|
|
Total |
|
||||
Net sales from external customers |
|
$ |
|
|
$ |
|
|
$ |
|
|
$ |
|
||||
Reportable segment total cost of sales |
|
|
|
|
|
|
|
|
|
|
|
|
||||
Reportable segment gross profit |
|
$ |
|
|
$ |
|
|
$ |
|
|
$ |
|
||||
Selling, engineering and administrative expenses (a) |
|
$ |
|
|
$ |
|
|
$ |
|
|
$ |
|
||||
Research and development (b) |
|
|
|
|
|
|
|
|
|
|
|
|
||||
Indirect expenses (c) |
|
|
|
|
|
|
|
|
|
|
|
|
||||
Amortization of intangible assets (d) |
|
|
- |
|
|
|
- |
|
|
|
|
|
|
|
||
Operating income |
|
$ |
|
|
$ |
|
|
$ |
( |
) |
|
$ |
|
|||
(a)
(b)
(c)
(d)
|
|
At and for the Year Ended December 31, 2022 |
|
|||||||||||||
|
|
Hydraulics |
|
|
Electronics |
|
|
Unallocated expenses |
|
|
Total |
|
||||
Net sales from external customers |
|
$ |
|
|
$ |
|
|
$ |
|
|
$ |
|
||||
Reportable segment total cost of sales |
|
|
|
|
|
|
|
|
|
|
|
|
||||
Reportable segment gross profit |
|
$ |
|
|
$ |
|
|
$ |
|
|
$ |
|
||||
Selling, engineering and administrative expenses (a) |
|
$ |
|
|
$ |
|
|
$ |
|
|
$ |
|
||||
Research and development (b) |
|
|
|
|
|
|
|
|
|
|
|
|
||||
Indirect expenses (c) |
|
|
|
|
|
|
|
|
|
|
|
|
||||
Amortization of intangible assets (d) |
|
|
|
|
|
|
|
|
|
|
|
|
||||
Operating income |
|
$ |
|
|
$ |
|
|
$ |
( |
) |
|
$ |
|
|||
(a)
(b)
(c)
(d)
83
|
|
For the year ended |
|
|||||||||
|
|
December 28, 2024 |
|
|
December 30, 2023 |
|
|
December 31, 2022 |
|
|||
Capital expenditures |
|
|
|
|
|
|
|
|
|
|||
Hydraulics |
|
$ |
|
|
$ |
|
|
$ |
|
|||
Electronics |
|
|
|
|
|
|
|
|
|
|||
Total |
|
$ |
|
|
$ |
|
|
$ |
|
|||
Goodwill |
|
|
|
|
|
|
|
|
|
|||
Hydraulics |
|
$ |
|
|
$ |
|
|
$ |
|
|||
Electronics |
|
|
|
|
|
|
|
|
|
|||
Total |
|
$ |
|
|
$ |
|
|
$ |
|
|||
Total assets |
|
|
|
|
|
|
|
|
|
|||
Hydraulics |
|
$ |
|
|
$ |
|
|
$ |
|
|||
Electronics |
|
|
|
|
|
|
|
|
|
|||
Corporate and Other |
|
|
|
|
|
|
|
|
|
|||
Total |
|
$ |
|
|
$ |
|
|
$ |
|
|||
Depreciation and amortization |
|
|
|
|
|
|
|
|
|
|||
Hydraulics |
|
$ |
|
|
$ |
|
|
$ |
|
|||
Electronics |
|
|
|
|
|
|
|
|
|
|||
Corporate and Other |
|
|
|
|
|
|
|
|
|
|||
Total |
|
$ |
|
|
$ |
|
|
$ |
|
|||
Geographic Region Information:
Net sales are measured based on the geographic destination of sales. In 2024, sales to the U.S. represented approximately
|
|
2024 |
|
|
2023 |
|
|
2022 |
|
|||
Net sales |
|
|
|
|
|
|
|
|
|
|||
Americas |
|
$ |
|
|
$ |
|
|
$ |
|
|||
EMEA |
|
|
|
|
|
|
|
|
|
|||
APAC |
|
|
|
|
|
|
|
|
|
|||
Total |
|
$ |
|
|
$ |
|
|
$ |
|
|||
|
|
|
|
|
|
|
|
|
|
|||
Tangible long-lived assets |
|
|
|
|
|
|
|
|
|
|||
Americas |
|
$ |
|
|
$ |
|
|
|
|
|||
EMEA |
|
|
|
|
|
|
|
|
|
|||
APAC |
|
|
|
|
|
|
|
|
|
|||
Total |
|
$ |
|
|
$ |
|
|
|
|
|||
17. RELATED PARTY TRANSACTIONS
The Company purchases from, and sells inventory to, entities partially owned or managed by directors of Helios. For the years ended December 28, 2024, December 30, 2023 and December 31, 2022, inventory sales to the entities totaled $
84
At December 28, 2024 and December 30, 2023, total amounts due from the entities totaled $
In March 2022, the Company completed a sale of real estate to one of its executive officers for $
18. COMMITMENTS AND CONTINGENCIES
Building Purchase Commitment
The Company is negotiating a lease to buy agreement for the purchase of a building for an expected purchase price of €
Legal Proceedings
The Company is not a party to any legal proceedings other than routine litigation incidental to its business. In the opinion of management, the amount of ultimate liability with respect to these actions will not materially affect the results of operations, financial position or cash flows of the Company.
Insurance
The Company accrues for certain health care benefit costs under a self-funded plan and records a liability for all unresolved claims at the anticipated cost to the Company at the end of the period based on management’s assessment. The Company believes it has adequate reserves for all self-insured claims.
Letters of Credit
In the ordinary course of business, the Company is at times required to post letters of credit. The letters of credit are issued by financial institutions to guarantee our obligations to various parties. The Company was contingently liable for $
Gain Contingency
In the third quarter of 2023, the Company incurred significant losses due to a fire and a weather-related incident at one of its manufacturing facilities in Italy, resulting in a temporary shutdown and production disruption during recovery efforts. The affected operations have since been restored. At the end of 2024, we recognized a contingent gain of $
19. SUBSEQUENT EVENTS
The company evaluated subsequent events through the date the consolidated financial statements were issued. The Company did not identify any subsequent events that would require adjustment.
In January 2025,
85
ITEM 9. CHANGES IN AND DISAGREEMENTS WITH
ACCOUNTANTS ON ACCOUNTING AND FINANCIAL DISCLOSURE
None.
ITEM 9A. CONTROLS AND PROCEDURES
Disclosure Controls and Procedures
The Company’s management, with the participation of the President and Chief Executive Officer and Chief Financial Officer, after evaluating the effectiveness of the Company’s “disclosure controls and procedures” (as defined in Rules 13a-15(e) and 15d-15(e) under the Securities Exchange Act of 1934, as amended, the “Exchange Act”) as of the end of the period covered by this report, have concluded that our disclosure controls and procedures are effective and are designed to ensure that the information we are required to disclose is recorded, processed, summarized and reported within the necessary time periods. Our disclosure controls and procedures include, without limitation, controls and procedures designed to ensure that information required to be disclosed by us in reports that we file or submit pursuant to the Exchange Act is accumulated and communicated to our management, including our Chief Executive Officer and Chief Financial Officer, as appropriate, to allow timely decisions regarding required disclosure.
Management’s Report on Internal Control over Financial Reporting
Management of the Company is responsible for establishing and maintaining adequate internal control over financial reporting, as such term is defined in Exchange Act Rule 13a-15(f). The Company’s internal control over financial reporting is a process designed to provide reasonable assurance regarding the reliability of financial reporting and the preparation of financial statements for external purposes in accordance with U.S. GAAP. Internal control over financial reporting includes those policies and procedures that:
Because of its inherent limitations, internal control over financial reporting may not prevent or detect misstatements. Management, with the participation of the President and Chief Executive Officer and Chief Financial Officer, conducted an evaluation of the effectiveness of the Company’s internal control over financial reporting based on the criteria set forth in Internal Control - Integrated Framework (2013) issued by the Committee of Sponsoring Organizations of the Treadway Commission. Based on this evaluation under the Internal Control - Integrated Framework, management, with the participation of the Chief Executive Officer and Chief Financial Officer, concluded that the internal control over financial reporting was effective as of December 28, 2024.
Changes in Internal Control Over Financial Reporting
There were no changes in the Company’s internal control over financial reporting during the year ended December 28, 2024, that materially affected, or are reasonably likely to materially affect, the Company’s internal control over financial reporting.
86
Attestation Report of Independent Registered Public Accounting Firm
Grant Thornton LLP, our independent registered public accounting firm, has issued an attestation report on our internal control over financial reporting. This report appears on page 52.
ITEM 9B. OTHER INFORMATION
During the quarter ended December 28, 2024, none of the Company's directors or executive officers
ITEM 9C. DISCLOSURE REGARDING FOREIGN JURISDICTIONS THAT PREVENT INSPECTIONS
Not applicable.
87
PART III
ITEM 10. DIRECTORS, EXECUTIVE OFFICERS AND CORPORATE GOVERNANCE
Executive Officers
The information required by this item with respect to our executive officers is set forth in our 2025 Proxy Statement under the caption “Governance of the Company” and is incorporated herein by reference. The information required by this item with respect to our Insider Trading Policy is set forth in our 2025 Proxy Statement under the caption “Insider Trading Policy” and is incorporated herein by reference.
Directors
The information required by this item with respect to our Board of Directors and committees thereof is set forth in our 2025 Proxy Statement under the caption “Governance of the Company” and is incorporated herein by reference.
Delinquent Section 16(a) Reports
The information required by this item with respect to Section 16(a) beneficial ownership reporting compliance is set forth in our 2025 Proxy Statement under the caption “Section 16(a) Beneficial Ownership Reporting Compliance” and is incorporated herein by reference.
Code of Business Conduct and Ethics
The information required by this item with respect to our Code of Business Conduct and Ethics is set forth in our 2025 Proxy Statement under the caption “Governance of the Company” and is incorporated herein by reference.
ITEM 11. EXECUTIVE COMPENSATION
The information required by this item is set forth under the caption “Executive Compensation” in our 2025 Proxy Statement and is incorporated herein by reference.
ITEM 12. SECURITY OWNERSHIP OF CERTAIN BENEFICIAL OWNERS
AND MANAGEMENT AND RELATED STOCKHOLDER MATTERS
The information required by this item with respect to equity compensation plans is set forth under the caption “Equity Compensation Plan Information” in our 2025 Proxy Statement and with respect to security ownership of certain beneficial owners, directors and executive officers is set forth under the caption “Security Ownership of Certain Beneficial Owners and Management and Related Shareholder Matters” in our 2025 Proxy Statement and is incorporated herein by reference.
The information required by this item is set forth under the captions “Compensation Committee Interlocks and Insider Participation,” “Certain Relationships and Related Transactions” and “Independence and Committees of the Board of Directors” in our 2025 Proxy Statement and is incorporated herein by reference.
ITEM 14. PRINCIPAL ACCOUNTANT FEES AND SERVICES
The information required by this item is set forth under the caption “Ratification of the Appointment of Independent Registered Public Accounting Firm” in our 2025 Proxy Statement and is incorporated herein by reference.
88
PART IV
ITEM 15. EXHIBIT AND FINANCIAL STATEMENT SCHEDULES
|
|
Page |
1. The following financial statements are included in Part II, Item 8: |
|
|
|
|
|
|
50 |
|
|
|
|
Consolidated Balance Sheets as of December 28, 2024 and December 30, 2023 |
|
53 |
|
|
|
|
54 |
|
|
|
|
|
55 |
|
|
|
|
|
56 |
|
|
|
|
|
57 |
|
|
|
|
|
59 |
All other schedules are omitted as the required information is inapplicable or the information is presented in the Consolidated Financial Statements and notes thereto in Item 8 above.
89
2. Exhibits: |
|
|
|
|
|
Exhibit Number |
|
Exhibit Description |
|
|
|
3.1 |
|
|
|
|
|
3.2 |
|
|
|
|
|
3.3 |
|
|
|
|
|
3.4 |
|
|
|
|
|
3.5 |
|
|
|
|
|
4.1 |
|
|
|
|
|
10.1+ |
|
|
|
|
|
10.2+ |
|
|
|
|
|
10.3+ |
|
|
|
|
|
10.4+ |
|
|
|
|
|
10.5+ |
|
|
|
|
|
10.7+ |
|
90
10.8+ |
|
|
|
|
|
10.9+ |
|
|
|
|
|
10.10+ |
|
|
|
|
|
10.11+ |
|
|
|
|
|
10.12 |
|
|
|
|
|
10.13 |
|
|
|
|
|
10.14 |
|
|
|
|
|
10.15 |
|
|
|
|
|
10.16 |
|
|
|
|
|
10.17 |
|
|
|
|
|
10.18 |
|
91
10.19 |
|
|
|
|
|
10.20+ |
|
|
|
|
|
10.21+ |
|
|
|
|
|
10.22+ |
|
|
|
|
|
10.23+ |
|
|
|
|
|
10.24+ |
|
|
|
|
|
10.25+ |
|
|
|
|
|
10.26+ |
|
|
|
|
|
10.27+ |
|
|
|
|
|
10.28+ |
|
|
|
|
|
10.29 |
|
Fourth Amendment to Second Amended and Restated Credit Agreement among Helios Technologies, Inc. as |
|
|
|
10.30 |
|
Incremental Facility Amendment to Second Amended and Restated Credit Agreement among Helios (previously filed as Exhibit 10.1 to the Company’s Report on Form 8-K filed on May 17, 2023, and |
|
|
|
14 |
|
|
|
|
|
92
19.1 |
|
|
|
|
|
21.1 |
|
|
|
|
|
23.1 |
|
|
|
|
|
31.1 |
|
CEO and CFO Certification pursuant to Section 302 of the Sarbanes-Oxley Act of 2002. |
|
|
|
32.1 |
|
|
|
|
|
97.1 |
|
|
|
|
|
101.INS |
|
Inline XBRL Instance Document – the instance document does not appear in the Interactive Data File because its XBRL tags are embedded within the Inline XBRL document. |
|
|
|
101.SCH |
|
Inline XBRL Taxonomy Extension Schema With Embedded Linkbase Documents |
|
|
|
104 |
|
The cover page from the Company’s Annual Report on Form 10-K for the year ended December 28, 2024, has been formatted in Inline XBRL. |
+ Executive management contract or compensatory plan or arrangement.
* Certain portions of the exhibit have been omitted pursuant to Rule 601(b)(2) of Regulation S-K. The omitted information is not material.
93
ITEM 16. FORM 10-K SUMMARY
None.
94
SIGNATURES
Pursuant to the requirements of Section 13 or 15(d) of the Securities Exchange Act of 1934, the Registrant has duly caused this Report to be signed on its behalf by the undersigned, thereunto duly authorized on February 25, 2025.
|
|
HELIOS TECHNOLOGIES, INC. |
||
|
|
|
|
|
|
|
By: |
|
/s/ Sean Bagan |
|
|
|
|
Sean Bagan, President, Chief Executive Officer, and Chief Financial Officer |
Pursuant to requirements of the Securities Exchange Act of 1934, this Report has been signed by the following persons on behalf of the Registrant and in the capacities and on the dates indicated.
Signature |
|
Title |
Date |
|
|
|
|
/s/ Sean Bagan |
|
President, Chief Executive Officer, and Chief Financial Officer (Principal Financial and Accounting Officer) |
February 25, 2025 |
Sean Bagan |
|
|
|
|
|
|
|
/s/ Philippe Lemaitre |
|
Director, Chairman of the Board of Directors |
February 25, 2025 |
Philippe Lemaitre |
|
|
|
|
|
|
|
/s/ Laura Dempsey Brown |
|
Director |
February 25, 2025 |
Laura Dempsey Brown |
|
|
|
|
|
|
|
/s/ Douglas M. Britt |
|
Director |
February 25, 2025 |
Douglas M. Britt |
|
|
|
95